1. Introduction
1.1 What Warehouse Operations is
Warehouse Operations shows what is happening in your warehouse right now, using the data in Business Central (BC). You see picks, put-aways, receipts, shipments and movements by hour and by person, what is due to go out today, what is due to come in, how each person is tracking against the targets, and alerts when something needs attention.
There are two apps:
- Warehouse Operations: the desktop app. It stretches to any screen, from a laptop to a large TV on the warehouse wall. It also has a TV mode that rotates between screens on its own.
- Warehouse Operations Mobile: the phone app, for a quick look on the floor or away from the warehouse.
The apps only read your business data. They never change orders, documents, stock or ledgers. Business Central collects new warehouse work about every minute during open hours, so the screens are always close to live.
1.2 Who this guide is for
This guide is for warehouse supervisors, warehouse and operations managers, and anyone who looks at the app or the TV. It explains each screen and how every number on it is calculated. Setting up the extension in Business Central is covered in the separate Warehouse Operations Setup Guide.
1.3 How it fits together
The picture shows all the parts and how the data flows from the scanners to the screens.
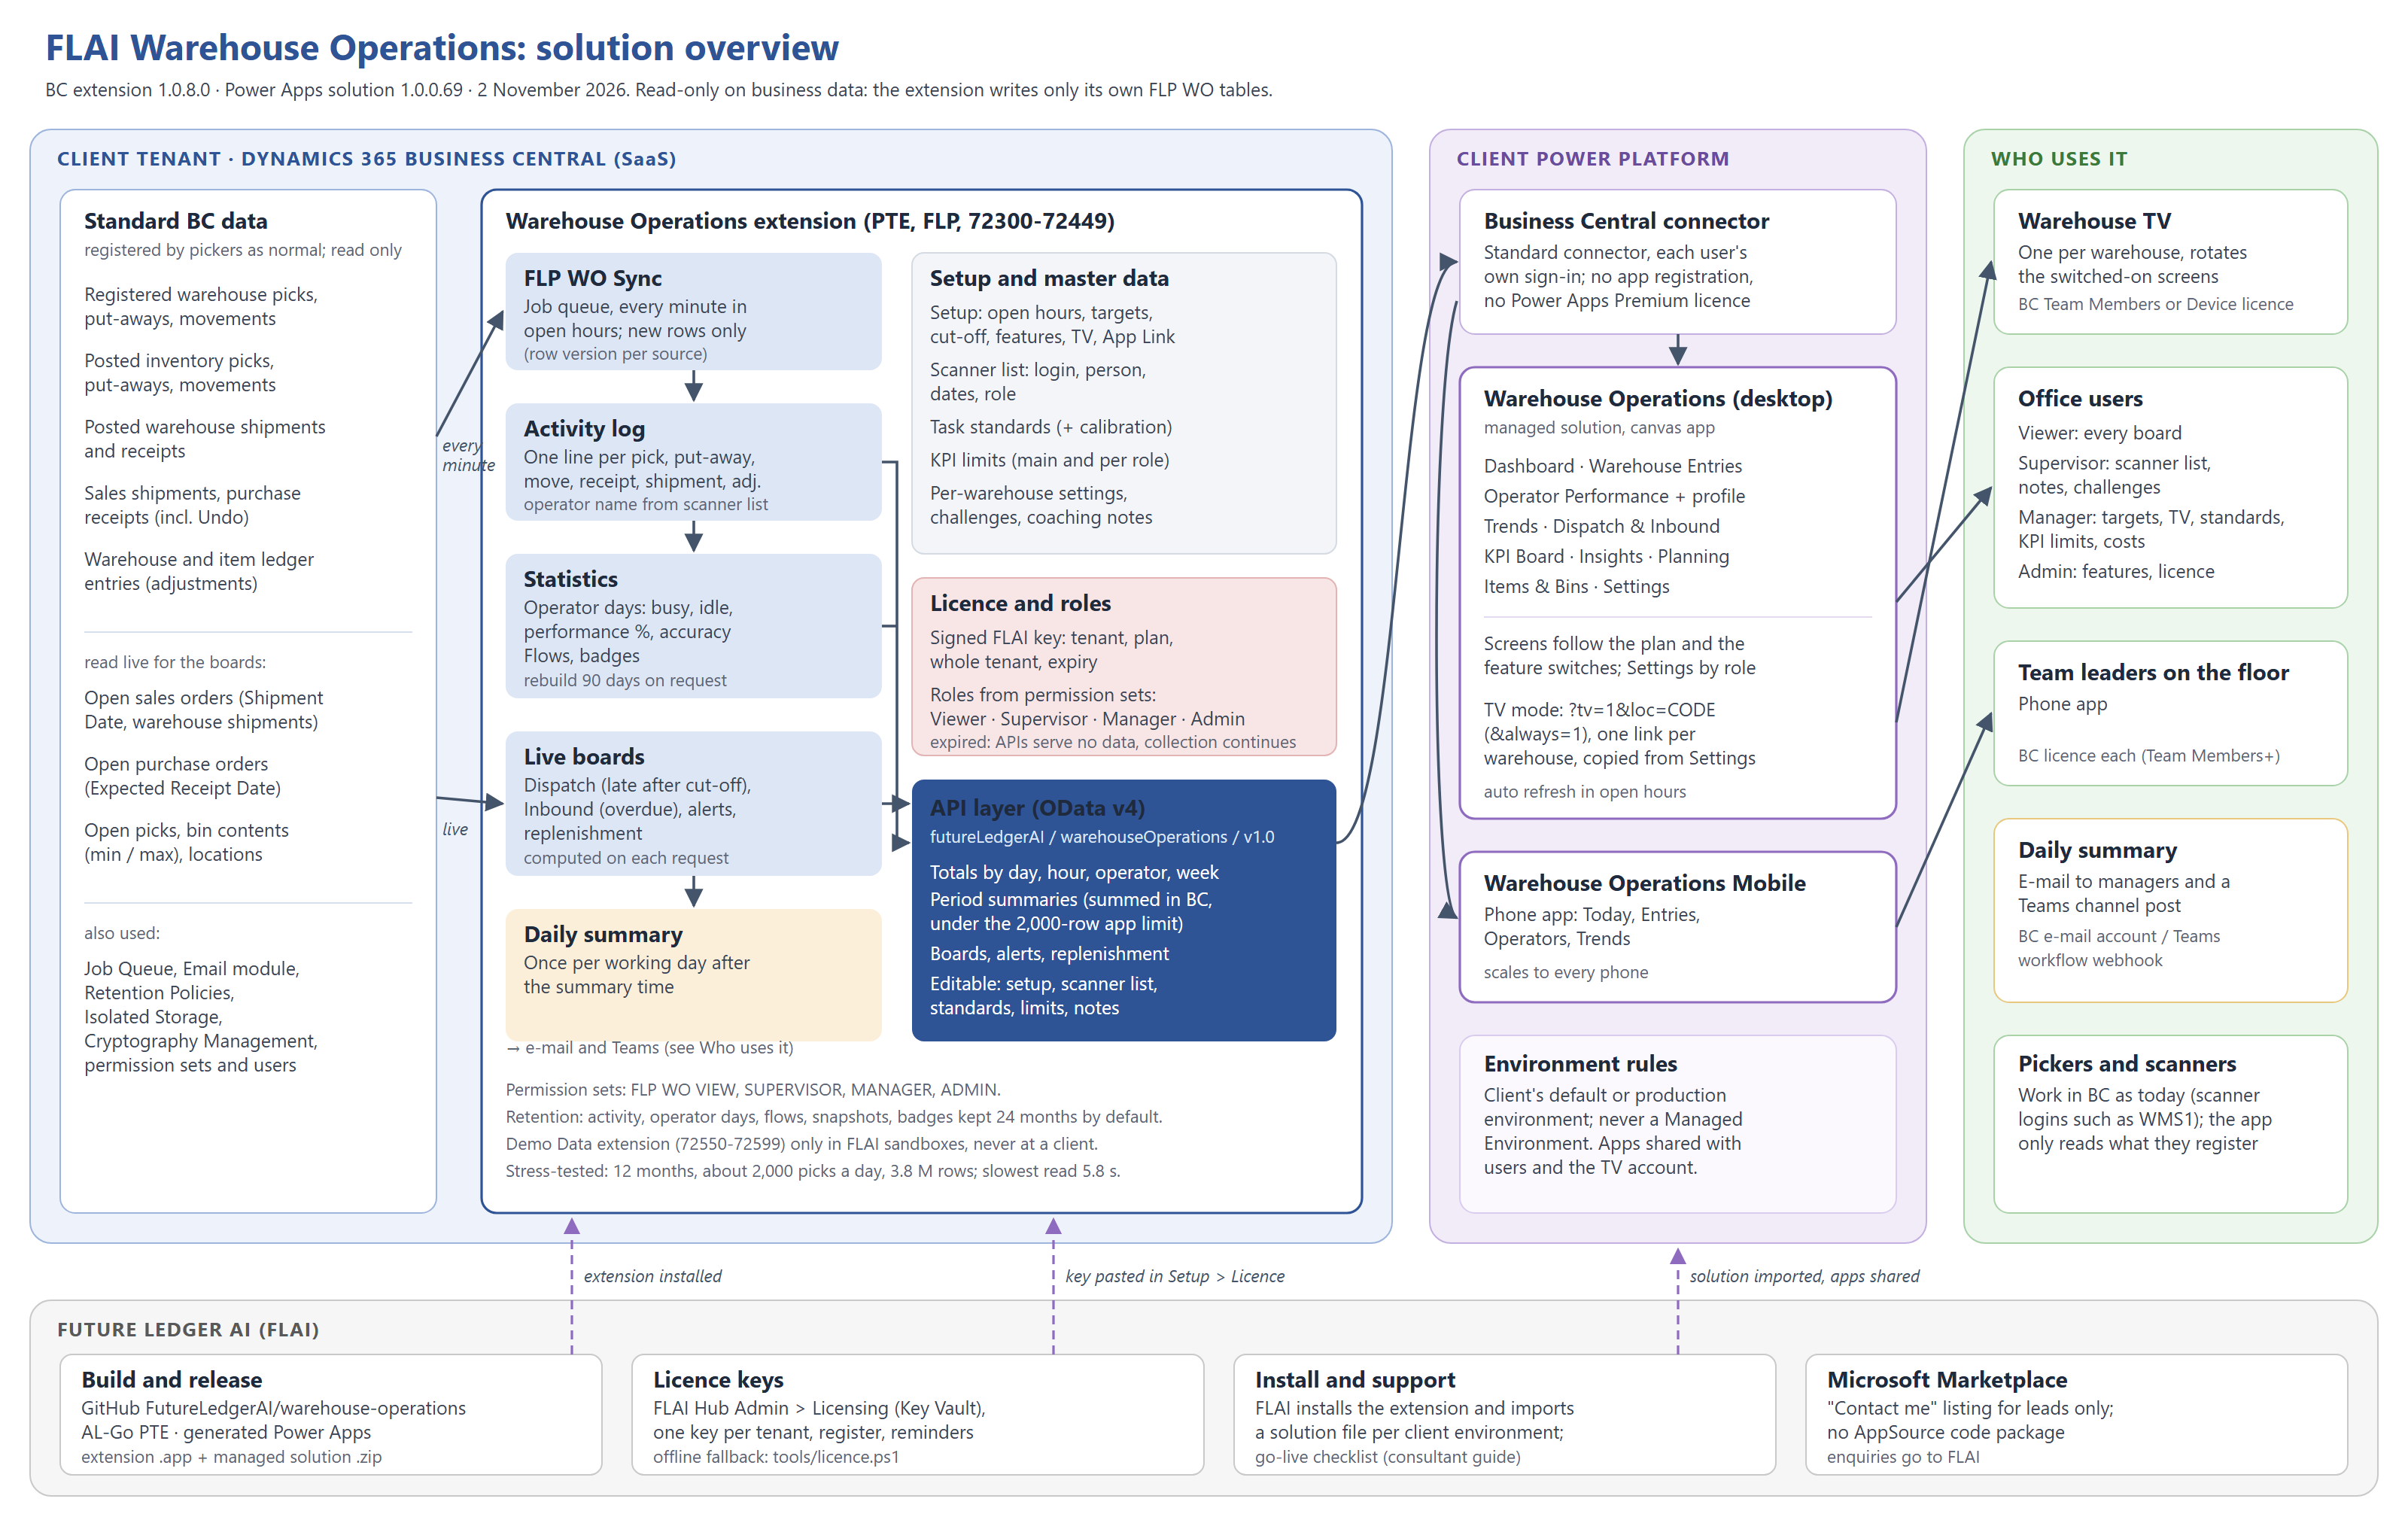
Warehouse Operations: the parts and the data flow
- Your team registers picks, put-aways and other warehouse work in Business Central as usual, on scanners or on screen.
- Every minute during open hours, a Business Central job collects the new work into the Warehouse Activity Entries list. Each entry records what was done, where, when, by whom and how much.
- The scanner login is turned into a person's name using the scanner-to-person list (chapter 14).
- Straight after each collection, Business Central updates its own statistics: one row per person per day (time on the job, idle time, performance and accuracy), order and receipt flows, and badges.
- The app reads the totals from Business Central each time it refreshes, using your own Business Central sign-in. Dispatch & Inbound, the alerts and the replenishment list are worked out live from the sales and purchase orders each time they load.
It works with every warehouse setup: directed put-away and pick, warehouse shipments and receipts, inventory picks and put-aways, and locations without warehouse documents.
1.4 What counts as a pick, a shipment and a late order
| Term | What counts |
|---|---|
| Pick | Each registered warehouse pick line (the Take line), at the time it was registered. For inventory picks, each posted inventory pick line. At a location that does not use picks, the posted shipment line also counts as the pick. The person is the Assigned User on the pick, or else the user who registered it (your administrator can change this). |
| Picks (on the screens) | Pick documents: one registered pick, whatever the number of lines on it. Pick lines are the lines on those picks. |
| Shipment | Each posted warehouse shipment line, or each posted sales shipment line where the location does not use warehouse shipments. Undo Shipment takes the shipment off again; the pick stays counted, because the work was done. Receipts and put-aways work the same way. |
| Due order (Dispatch) | A sales order with item lines still to ship whose Shipment Date is today or earlier, plus orders shipped in full today. |
| Late (Dispatch) | A due order that is not shipped and either has an open line with a Shipment Date before today, or it is now past the warehouse's courier cut-off time. Without a cut-off, an order due today is never late on the day. Picked but not yet shipped still counts as late. |
| Expected (Inbound) | A purchase order with item lines still to receive whose Expected Receipt Date is today or earlier, plus receipts posted today. |
| Overdue (Inbound) | An expected purchase order with an open line whose Expected Receipt Date is before today. There is no cut-off for receipts. |
1.5 What your plan includes
Warehouse Operations comes in three plans. Your company's licence key sets the plan; Settings > Licence shows it. Screens and figures that your plan does not include are hidden, and feature switches show the plan name and cannot be turned on.
| Plan | Includes |
|---|---|
| Essentials | Dashboard, Warehouse Entries, Operator Performance (operator list with picks, lines and pick-rate bars against the target, in blue), Trends, TV mode and TV links, the phone app, the scanner-to-person list with roles, and open hours. |
| Professional | Everything in Essentials, plus Dispatch & Inbound with alerts, the KPI Board, KPI limits (also per operator role), operator status colours (On target, Watch, Needs attention) and accuracy, Insights, Planning, the daily summary and branding. |
| Enterprise | Everything in Professional, plus idle time, task standards and performance % (with Calibrate from last 4 weeks), badges, challenges, coaching notes, flow KPIs (order cycle time, dock-to-stock, on-time %), Items & Bins, the replenishment watch and per-warehouse settings. |
A new installation runs as a 30-day trial with everything switched on. Section 2.7 explains the trial and licence messages.
1.6 Your role
What you can change depends on the Warehouse Operations permission set your Business Central administrator has given you. Your role shows in the top bar next to your name.
| Role | Permission set | What you can do |
|---|---|---|
| Viewer | FLP WO VIEW | See every screen your plan includes. No Settings menu and no cost figures. |
| Supervisor | FLP WO SUPERVISOR | As Viewer, plus the scanner-to-person list, challenges and coaching notes. |
| Manager | FLP WO MANAGER | As Supervisor, plus display, TV (including TV links), open hours, targets and alerts, task standards and calibration, KPI limits and warehouse settings. Sees labour costs on Insights. |
| Admin | FLP WO ADMIN (or SUPER) | As Manager, plus feature switches, branding, the daily summary and the licence key. |
Without any Warehouse Operations permission set, the app shows No access to Warehouse Operations and names the permission sets to ask for. The permission set must be assigned to you directly in Business Central; a set you only get through a security group gives you the Viewer role at most.
2. Opening the app
2.1 On a desktop or laptop
Your administrator shares the app with you and sends you its link. Open the link in Microsoft Edge or Google Chrome and sign in with your work Microsoft account (the one you use for Outlook or Teams). You can also find the app at make.powerapps.com or in the Power Apps list in Microsoft 365, under Apps.
2.2 On your phone
- Install Power Apps from the App Store (iPhone) or Google Play (Android).
- Open it and sign in with your work Microsoft account.
- Choose Warehouse Operations Mobile. Tap the star to make it a favourite, so it is at the top next time.
2.3 On a TV
The easiest way is a ready-made TV link. A manager copies it from Settings > TV > TV links to copy (section 15.2): there is one link per warehouse, and it opens that warehouse in TV mode. Open the link in the TV's browser (or on the small computer connected to the TV).
You can also build the link yourself. Add these settings to the end of the desktop app link:
- tv=1 turns on TV mode: no menu, larger layout and automatic rotation (chapter 15).
- loc=CODE opens that warehouse, for example loc=MAIN. Without it, or with a code that does not exist, the TV opens the default warehouse.
- hidenavbar=true hides the Power Apps bar at the top, so the whole screen is used.
For example: https://apps.powerapps.com/play/e/.../a/...?tenantId=...&tv=1&loc=MAIN&hidenavbar=true. If the link already has a ? in it, add the settings with &, as in the example. If it has no ?, start with ?tv=1.
2.4 The first time: Allow
The first time you open either app, Power Apps asks you to allow the connection to Business Central. Choose Allow. This only lets the app read Business Central as you; it does not give anyone else access. You are asked once per app, and again after a new version of the app is installed.
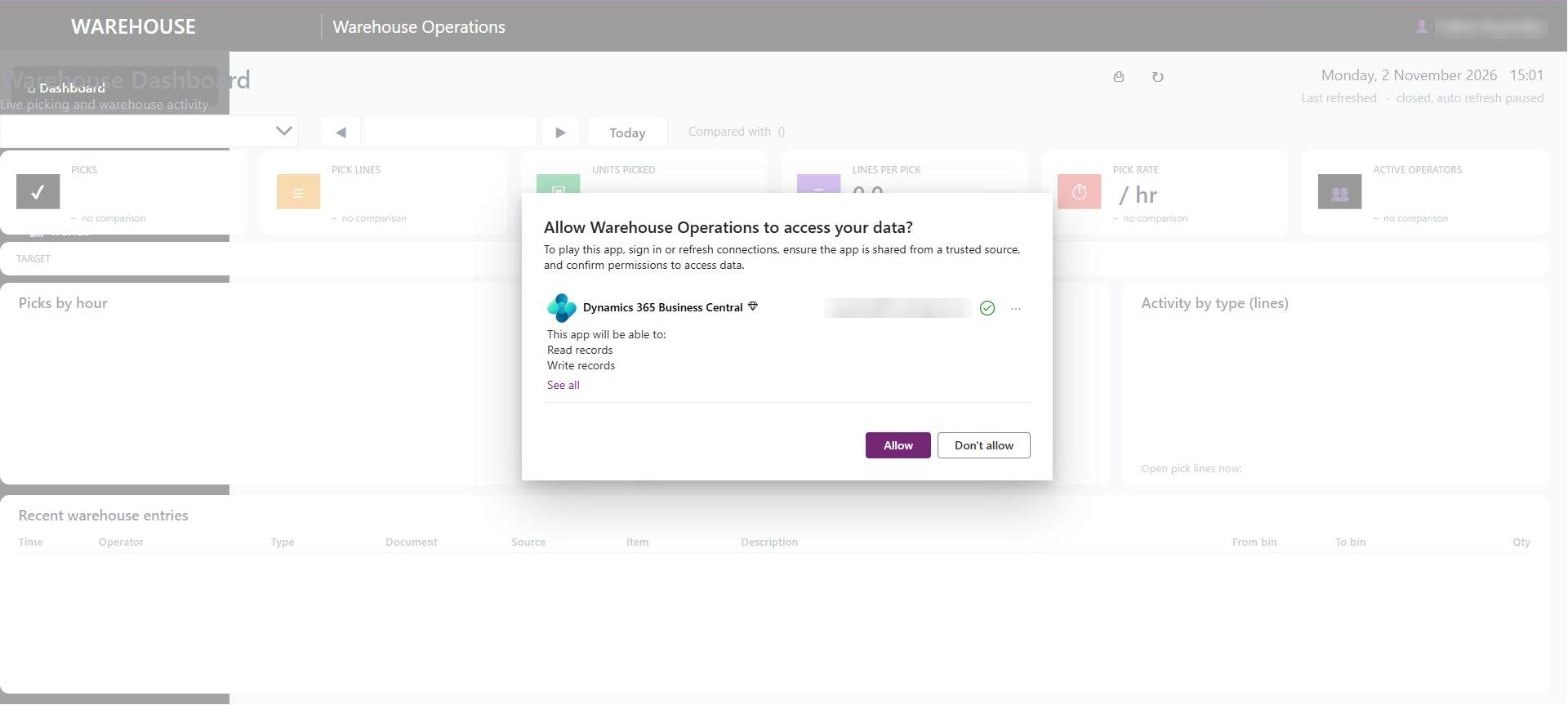
The first-run prompt: choose Allow to connect to Business Central
If you choose Don't allow by mistake, close the browser tab and open the link again. The prompt comes back.
2.5 Moving around
The menu on the left opens each screen, in this order: Dashboard, Warehouse Entries, Operator Performance, Trends, Dispatch & Inbound, KPI Board, Insights, Planning, Items & Bins and Settings. Screens that your plan does not include, or that your administrator has switched off, are not in the menu. Settings is only there for Supervisors, Managers and Admins.
Most screens have these controls at the top:
| Control | What it does |
|---|---|
| Warehouse | Chooses the location. All warehouses adds all locations together. The app opens on the default warehouse set by your manager, or the warehouse in the link (loc=). |
| Date with ◀ and ▶ | Shows another day (Dashboard, Warehouse Entries, Operator Performance and KPI Board). ▶ stops at today. Today jumps back to today. |
| ⎙ (print) | Prints the screen or saves it as a PDF (chapter 17). |
| ↻ (refresh) | Reloads the figures now, without waiting for the automatic refresh. |
| Your name and role | Who is signed in, and their role (section 1.6). |
| Trial or licence banner | During the trial, or when the licence has just expired, a line under the title says so (section 2.7). |
| Clock and Last refreshed | The time now and when the app last loaded the figures. |
| BC collected | When the Business Central collection job last ran. It runs every minute in open hours, so this should be a minute or two ago; outside open hours it does not run, so the time stays put until the next opening. |
Each screen reloads its figures every time you open it, and refreshes on its own at the refresh interval set in Settings (2 minutes by default) during open hours.
2.6 Open hours: when the app refreshes
Outside the warehouse's open hours nothing is being picked, so the app and Business Central rest:
- The app's open hours are the working days, from the Open from time to the Open to time (for example Monday to Friday, 6:00 to 16:30). A manager sets them in Settings > Hours; a warehouse can have its own hours (section 13.5).
- Outside open hours the automatic refresh and the TV rotation pause. The header shows closed, auto refresh paused. The ↻ button still works, so you can always load the latest figures yourself.
- A manager can also Pause auto refresh in Settings > Hours. The app then stops refreshing on its own and the TV stops rotating, also in open hours, until it is turned off. The header shows auto refresh paused in Settings.
- Business Central collects new work only on working days, from 30 minutes before the working day starts to 60 minutes after it ends. Nothing is lost: the first run of the morning collects everything posted overnight. Collect around the clock makes Business Central collect every minute, day and night, and keeps the app refreshing.
- To keep one screen refreshing around the clock (for a demo, or a TV that should always run), add &always=1 to the end of the app link.
Running TVs pick up a change to the hours, days or pause at their next refresh.
2.7 Trial, licence and access messages
| You see | What it means |
|---|---|
| Trial: n days left in the top bar | The 30-day trial is running. Everything is switched on. |
| A red Licence expired on ..., renew by ... line | The licence has expired, but the 14-day grace period is still running. Everything still works. |
| Licence expired or Licence key not valid over the whole screen | The trial or the grace period is over, or the key is not valid for your company. The app shows no figures. Your data is safe: Business Central keeps collecting, and everything comes back when a new key is entered. Admins can paste the new key straight into this panel and choose Apply key; everyone else asks their Warehouse Operations admin. |
| No access to Warehouse Operations | You have no Warehouse Operations permission set in Business Central (section 1.6). |
3. Dashboard
The Dashboard is the overview of the day: how much has been picked, how fast, against what target, and what needs attention.
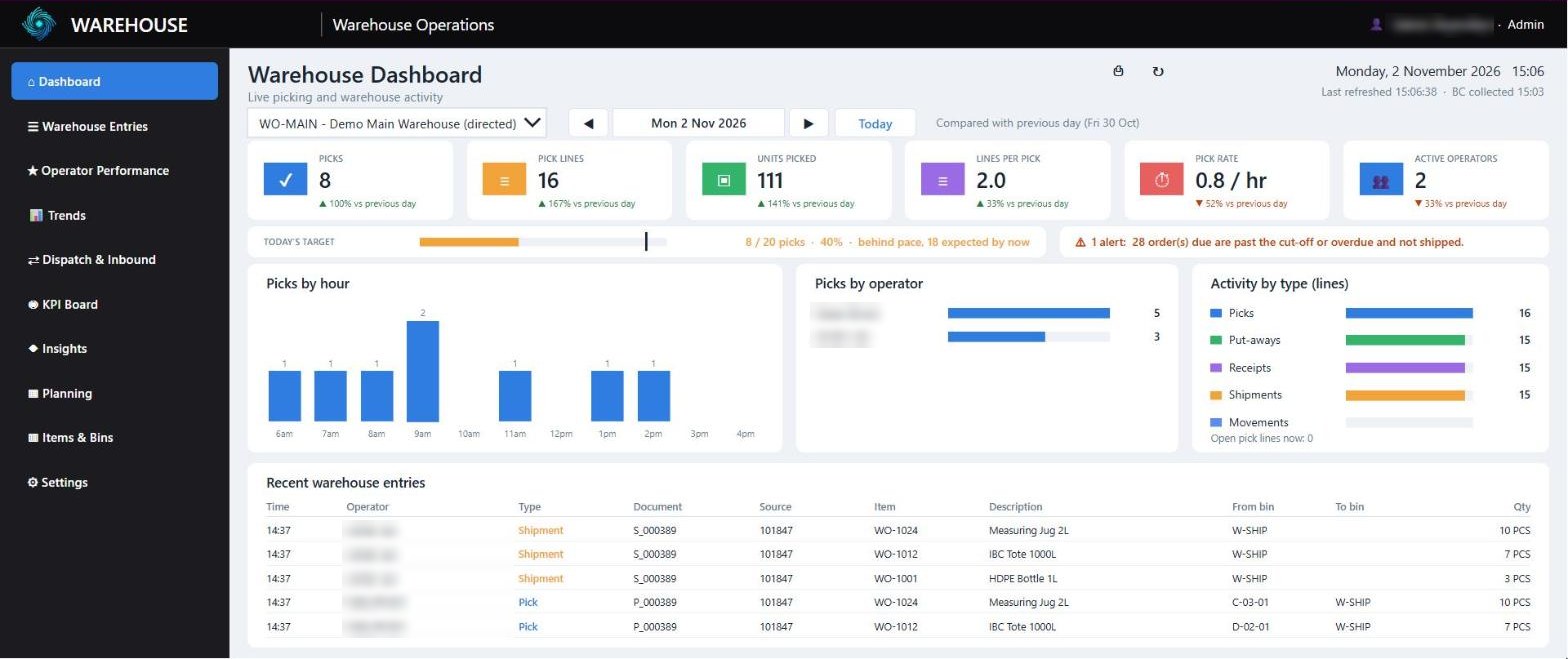
The Dashboard
3.1 The tiles
Six tiles across the top show the day's picking. Each tile also shows the change against the comparison day, for example ▲ 12% vs previous day (or vs last week). Green means higher than the comparison day, red means lower. No comparison means there were no figures on the comparison day. The line next to the date says which day is used, for example Compared with previous day (Mon 27 Oct).
| Number | How it is calculated |
|---|---|
| Picks | The number of pick documents registered on the day. A pick with 5 lines counts as 1 pick. |
| Pick lines | The number of lines on those picks. |
| Units picked | The total quantity on those pick lines. |
| Lines per pick | Pick lines / picks, with one decimal. A higher number means bigger picks. |
| Pick rate | Picks per active hour for all operators together (section 5.4), shown with one decimal. Your manager can switch this to picks per working-day hour or pick lines per active hour. |
| Active operators | The number of people (or logins) with at least one registered pick on the day. |
| % vs comparison day | (Day - comparison day) / comparison day x 100, rounded. The comparison day is the previous working day, or the same day last week, as set in Settings. |
The comparison uses the full comparison day, while today is still in progress. Early in the morning most tiles show red; that is normal.
3.2 Today's target
The bar under the tiles shows the day's picks against the daily pick target, for example 150 / 200 picks · 75% · on pace.
- The coloured bar fills from left to right: picks / daily target.
- The thin black marker shows where you should be by now: daily target x the share of the working day that has passed.
- The bar and text are green when picks are at or past the marker ("on pace") and orange when they are behind it ("behind pace, 120 expected by now").
Example: the working day is 6:00 to 16:00 (10 hours) and the target is 200 picks. At 11:00, 5 of the 10 hours have passed, so the marker is at 200 x 5 / 10 = 100 picks. With 92 picks registered, the bar is orange: "behind pace, 100 expected by now".
Before the working day starts the marker is at 0; after it ends the marker is at the full target. On a past day there is no marker, and the bar just shows picks against the target. On a non-working day there is no target: the bar says Closed day: no pick target with the picks done. If no target is set, it says Set a daily pick target in Settings. With its own warehouse settings, a warehouse uses its own target; All warehouses uses the main target.
3.3 Alerts strip
Next to the target bar, the alerts strip shows ✓ No alerts in green, or the number of open alerts and the most serious one, for example ⚠ 2 alerts: Pick PI-1042 has been open for 2 h 5 min. It is red when the most serious alert is critical and orange for a warning. Click it to open Dispatch & Inbound, which lists all alerts (section 8.5).
3.4 The charts and lists
| Number | How it is calculated |
|---|---|
| Picks by hour | Picks registered in each hour of the working day, by the time they were registered (local time). Hours run from the working-day start to the end hour. |
| Picks by operator | Picks per person on the day, the top 7, most picks first. |
| Activity by type (lines) | Lines registered on the day for each type: Pick, Put-away, Receipt, Shipment, Movement and Adjustment. |
| Open pick lines now | Pick lines created in Business Central that are not yet registered, right now. Put-aways and the place lines of picks are not included. |
| Recent warehouse entries | The latest 30 entries of the day, newest first: time, operator, type, document, source order, item, description, from bin, to bin and quantity. |
4. Warehouse Entries
Warehouse Entries lists every entry collected for the day, newest first. Use it to answer "who picked that order?" or "when did that item go out?".
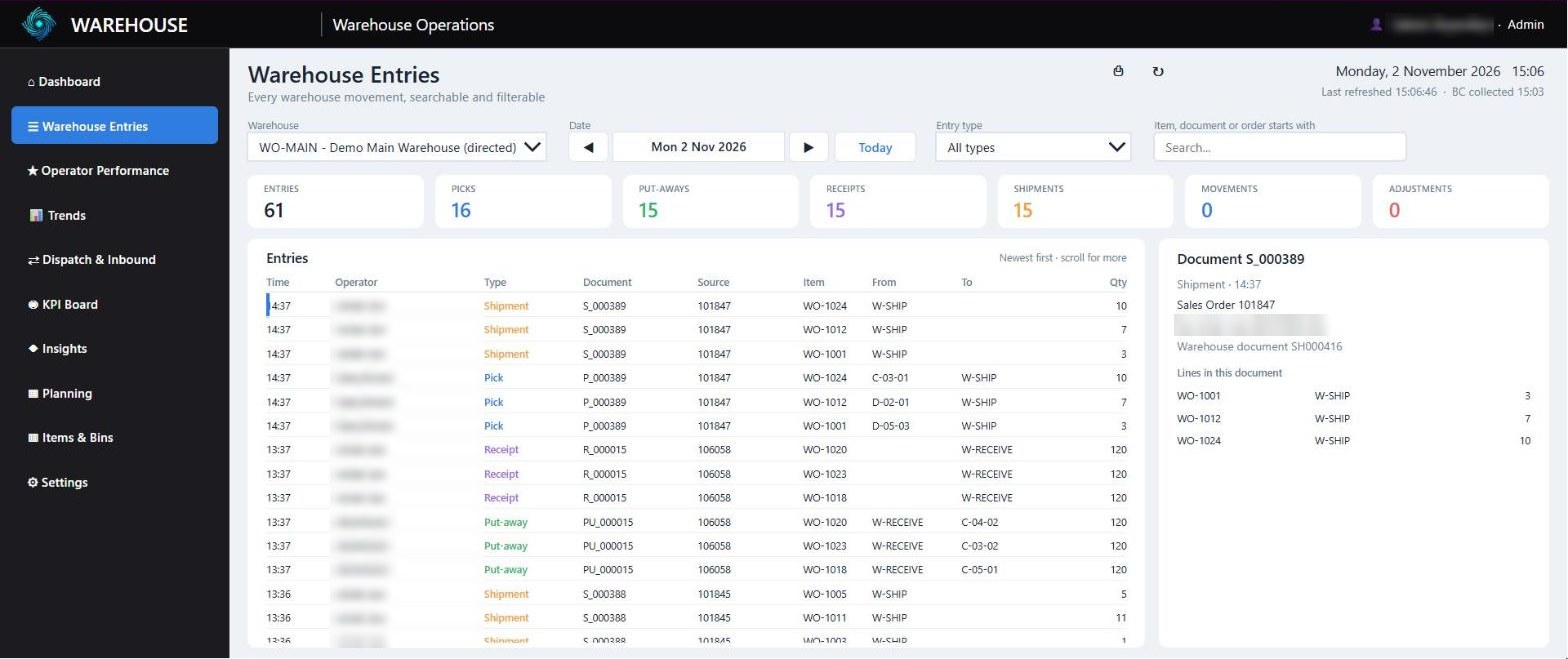
Warehouse Entries with the detail panel
- The totals row shows the day's lines: all entries, and picks, put-aways, receipts, shipments, movements and adjustments.
- Entry type filters to one activity type, or All types. Undone (Undo Shipment / Receipt) shows only the entries that were taken back with Undo Shipment or Undo Receipt; they show in red with Undone in front of the type.
- Item, document or order starts with searches the item number, the warehouse document number and the source order number. It matches from the start: SO-10 finds SO-1001 and SO-1023, but 1001 does not find SO-1001.
- Choose a line to see the whole document in the detail panel: the source order, the person (and login), the warehouse document and all its lines with bins and quantities.
One entry is one line of a registered or posted document. The Picks, Pick lines and Lines per pick figures on the other screens are counted from these entries.
5. Operator Performance
Operator Performance is the one place to see each person's work: how much, how fast and, with the Professional and Enterprise plans, how they are tracking against the KPI limits for their role. Choose Day, This week (Monday to the chosen date) or This month (the 1st to the chosen date).
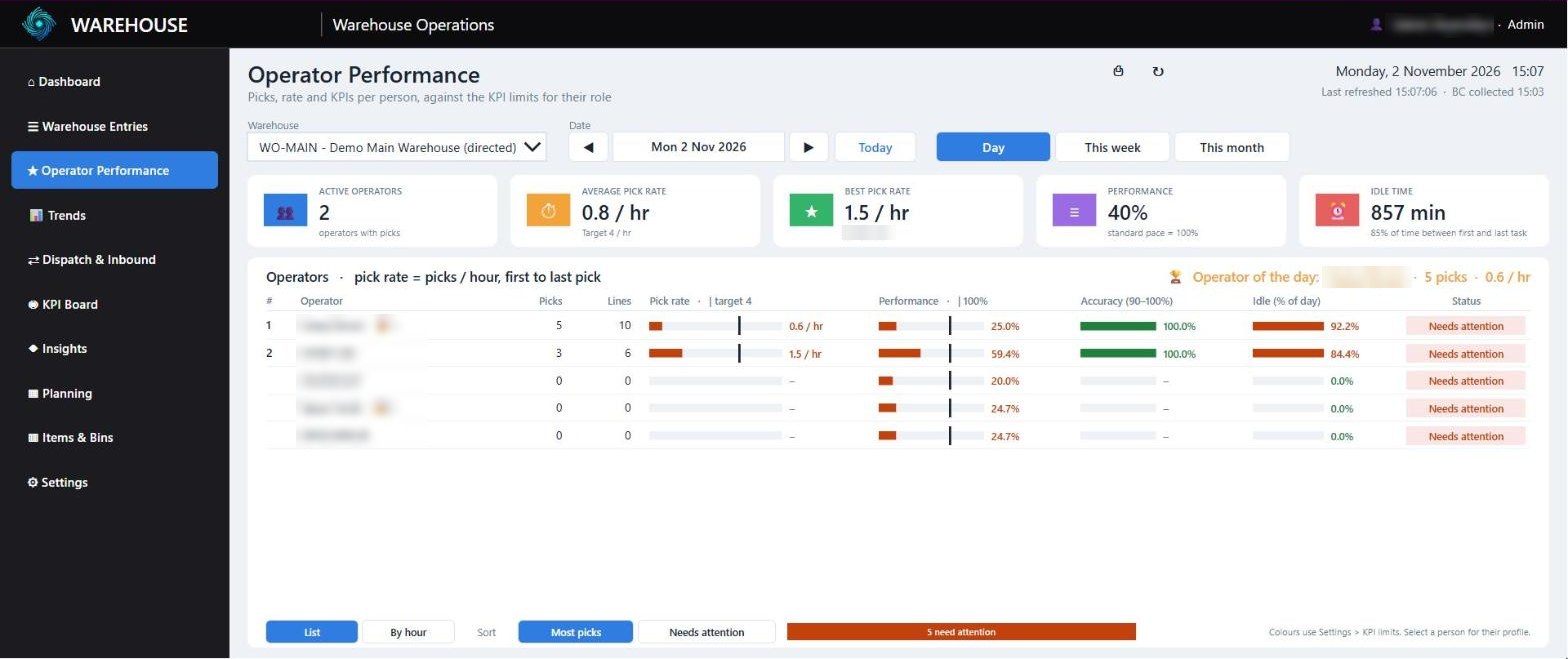
Operator Performance: one row per person, coloured by the KPI limits for their role
5.1 The tiles
| Number | How it is calculated |
|---|---|
| Active operators | People with at least one pick in the period. |
| Average pick rate | All picks of all operators / all their active hours (section 5.4). It is not the average of the individual rates. The line under it shows the pick rate target. |
| Best pick rate | The highest individual pick rate in the period, with the person's name. |
| Performance (Enterprise, task standards on) | All earned minutes / all busy minutes x 100 (section 5.5). 100% is standard pace. Without task standards this tile shows Lines per pick (pick lines / picks) instead. |
| Idle time (Enterprise, idle time on) | The total idle minutes in the period, and idle as a % of the time between first and last task. Without idle time this tile shows Hours active: the active hours of all operators. |
5.2 The operator list
The list has one row for each person with activity in the period, not only pickers. The title line says how the pick rate is worked out. On the right of the title, the banner names the Operator of the day (or week, or month): the person with the most picks, with their picks and pick rate. When that person reached the pick rate target on several days in a row (up to the chosen date, looking back up to 4 weeks), it adds n days in a row at target.
| Column | Meaning |
|---|---|
| # | Rank by picks. People with the same number of picks share a rank. People without picks have no rank. |
| Operator | The name from the scanner-to-person list, or the login when the login is not on the list or is marked spare. With badges on, 🏅 and a number show the badges won in the period. |
| Picks, Lines | Picks and pick lines in the period. |
| Pick rate | A bar with the person's picks per active hour. The black marker is the pick rate target. |
| Performance (Enterprise) | A bar from 0 to 150% with the person's performance %. The black marker is at 100%. |
| Accuracy (90-100%) (Professional) | A bar from 90% to 100% with the person's pick accuracy % (section 5.5). |
| Idle (% of day) (Enterprise) | A bar from 0 to 60% with idle minutes / time between first and last task. |
| Status (Professional) | A coloured pill: On target (green), Watch (amber) or Needs attention (red). It is the worst colour of the person's bars. |
A bar shows – when there is nothing to measure, for example no pick lines for accuracy or no task standard for performance.
5.3 Colours, roles and the controls
- With the Professional plan, each bar is coloured against the KPI limits in Settings (section 13.4): green on target, amber close, red needs attention. The pick rate uses the Picks vs target limits on the pick rate as a % of the target (by default green at 100% or more, amber from 85%).
- Each person is judged against the limits for their role (Picker, Receiver, Put-away or Dispatch, set on the scanner-to-person list). A role without its own limits uses the main limits. So a receiver is not marked red for a low pick rate if the Receiver limits allow it.
- With the Essentials plan, the bars are blue and there is no status.
- The bar at the bottom left switches between List and By hour. By hour shows a heat map of picks per person per working hour. Darker cells mean more picks.
- Sort: Most picks puts the busiest people first. Needs attention puts red first, then amber, then green, and the lowest pick rates first within each colour.
- The stacked bar next to the sort buttons counts the people who are on target, to watch and in need of attention.
- Select a person to open their Operator profile (chapter 6).
5.4 How the pick rate is calculated
Pick rate = picks / active hours.
- Active time is from a person's first pick to their last pick of the day, by registration time.
- Each person counts at least 15 minutes (0.25 h) per day, even with only one pick or picks close together. Without this minimum, one pick would give an impossible rate.
- For a week or month, the active hours of each day are added up (each day with its own 15-minute minimum).
Worked example (one morning):
| Operator | Picks | First pick | Last pick | Active hours | Pick rate |
|---|---|---|---|---|---|
| Taylor Smith | 2 | 06:58 | 07:19 | 21 min = 0.35 h | 2 / 0.35 = 5.7 / hr |
| Jordan Lee | 1 | 07:05 | 07:05 | 0 min, so the minimum 0.25 h | 1 / 0.25 = 4.0 / hr |
| Casey Brown | 1 | 07:12 | 07:12 | 0 min, so the minimum 0.25 h | 1 / 0.25 = 4.0 / hr |
| All | 4 | 0.85 h | 4 / 0.85 = 4.7 / hr |
The average pick rate is 4.7 per hour (all picks / all hours), not the average of 5.7, 4.0 and 4.0.
Your manager can choose another method in Settings > Display: picks per hour of the working day (picks / (operators x working hours so far)), or pick lines per active hour (lines instead of picks, same active hours). The pick rate target should match the method.
5.5 Idle time, performance and accuracy
These figures come from the operator day: one row per person, warehouse and day that Business Central keeps up to date after every collection.
Idle time (Enterprise)
A gap is the time between two of a person's entries in a row that is longer than the Idle gap setting (default 10 minutes, which allows for normal walking and handling). The idle minutes of a gap are the whole gap minus the idle gap. Busy minutes = time from first to last task - idle minutes.
Example (idle gap 10 minutes): entries at 07:00, 07:04 and 07:30 give gaps of 4 and 26 minutes. Only the 26-minute gap counts: idle = 26 - 10 = 16 minutes.
Performance % (Enterprise)
A task standard says how long a task should take: seconds per line plus seconds per document, for each activity type (optionally per warehouse and zone; the most specific one wins). The starting standards are Pick 30 s per line + 60 s per document, Put-away 40 + 60, Movement 40 + 30, Receipt 20 + 120, Shipment 10 + 120 and Adjustment 30 + 0.
- Earned minutes = (seconds per line x lines + seconds per document x documents) / 60, for all the person's work.
- Performance % = earned minutes / busy minutes x 100. 100% is standard pace, 120% is faster, 80% is slower.
Example: 40 pick lines in 12 picks = 40 x 30 s + 12 x 60 s = 1,920 s = 32 earned minutes. Busy time 40 minutes, so performance = 32 / 40 = 80%.
A manager can set the standards from your own recent work with Calibrate from last 4 weeks (section 13.3), so that a typical person scores about 100%.
Pick accuracy % (Professional)
Accuracy % = (pick lines - stock adjustment lines by the same person) / pick lines x 100. It is 100% when there are no adjustments. Example: 400 pick lines with 2 adjustment lines = 99.5%.
6. Operator profile
Select a person on Operator Performance to open their Operator profile: the last 12 weeks of that person's work. ← Operators goes back. The profile is not shown in TV mode.
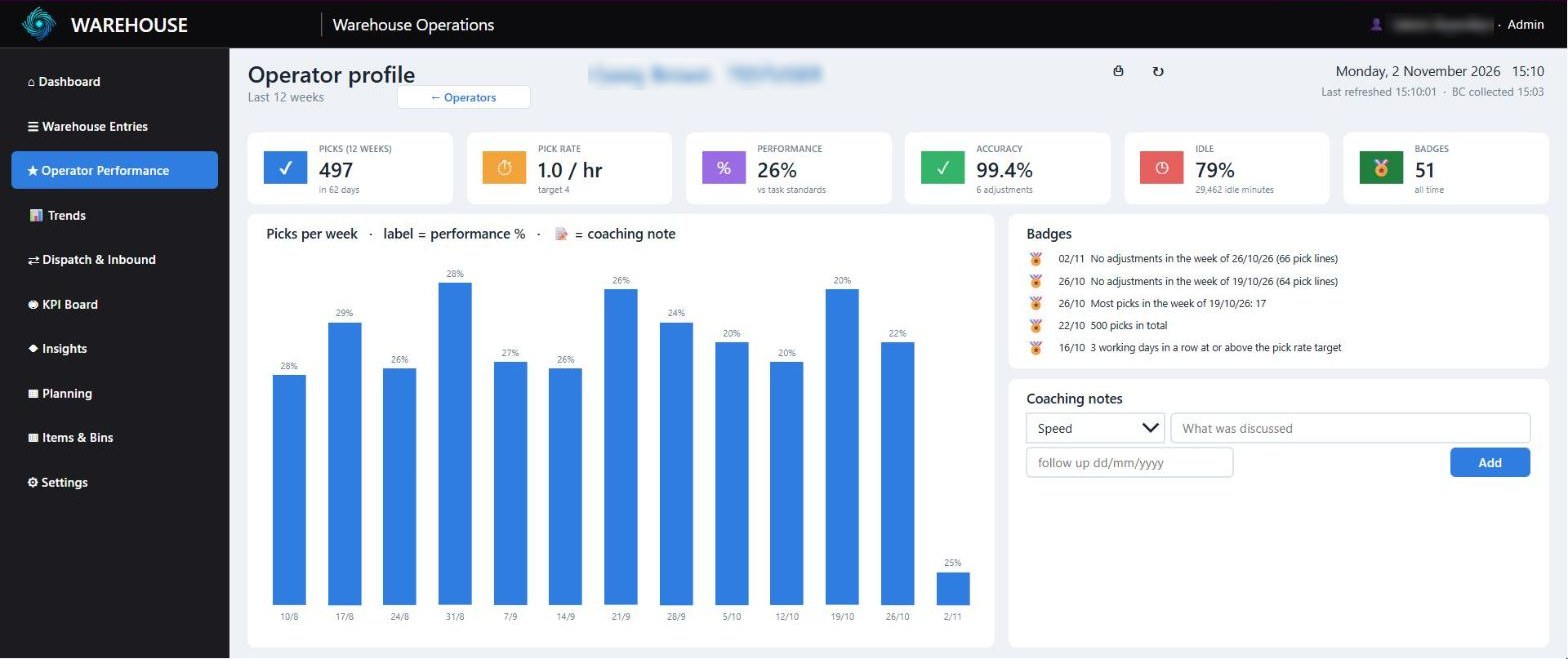
An operator profile: 12-week trend, badges and coaching notes
6.1 The tiles
| Number | How it is calculated |
|---|---|
| Picks (12 weeks) | All the person's picks in the last 12 weeks, and the number of days with picks. |
| Pick rate | Picks / pick hours over the 12 weeks. Pick hours per day: first to last pick, at least 15 minutes. The line under it shows the target. |
| Performance (Enterprise) | Earned minutes / busy minutes x 100 over the 12 weeks. |
| Accuracy | (Pick lines - adjustment lines) / pick lines x 100, with the number of adjustments. |
| Idle (Enterprise) | Idle minutes / time between first and last task x 100, with the idle minutes. |
| Badges (Enterprise) | The number of badges the person has won, all time. |
6.2 The 12-week trend
Picks per week shows a bar for each week. The label above each bar is the performance % for that week (or the picks, when task standards are off). A 📝 above a week means there is a coaching note in that week.
6.3 Badges (Enterprise)
The badges the person has won, newest first. Business Central awards them on its own:
| Badge | Rule |
|---|---|
| Picks 100 / 500 / 1,000 / 5,000 / 10,000 | The person's total picks since their first activity pass the number. |
| Streak 3 / 5 / 10 | That many working days in a row with a pick rate at or above the target. |
| Personal best | The most picks in a day the person has ever had (at least 10). |
| Top of the week | The most picks at the warehouse in a Monday to Sunday week (awarded on the Monday after). |
| Accuracy star | A full week with no adjustments and at least 50 pick lines. |
6.4 Coaching notes (Enterprise)
Coaching notes record what was discussed with the person. Only Supervisors, Managers and Admins see and add them.
- Choose the topic: Speed, Accuracy, Safety, Process, Praise or Other.
- Type what was discussed.
- Optionally enter a follow up date (dd/mm/yyyy).
- Choose Add. The note is saved with today's date and your name, and appears in the list and as a 📝 on the trend.
The list shows each note with its date, topic, who wrote it and the follow-up date. Coaching notes are never deleted automatically.
7. Trends
Trends shows how the warehouse is tracking over time. Choose the period (4 weeks, 12 weeks, 6 months or 12 months) and the Measure: Picks, Lines or Units, and with flow KPIs (Enterprise) also On-time %, Cycle hours and Dock-to-stock min.
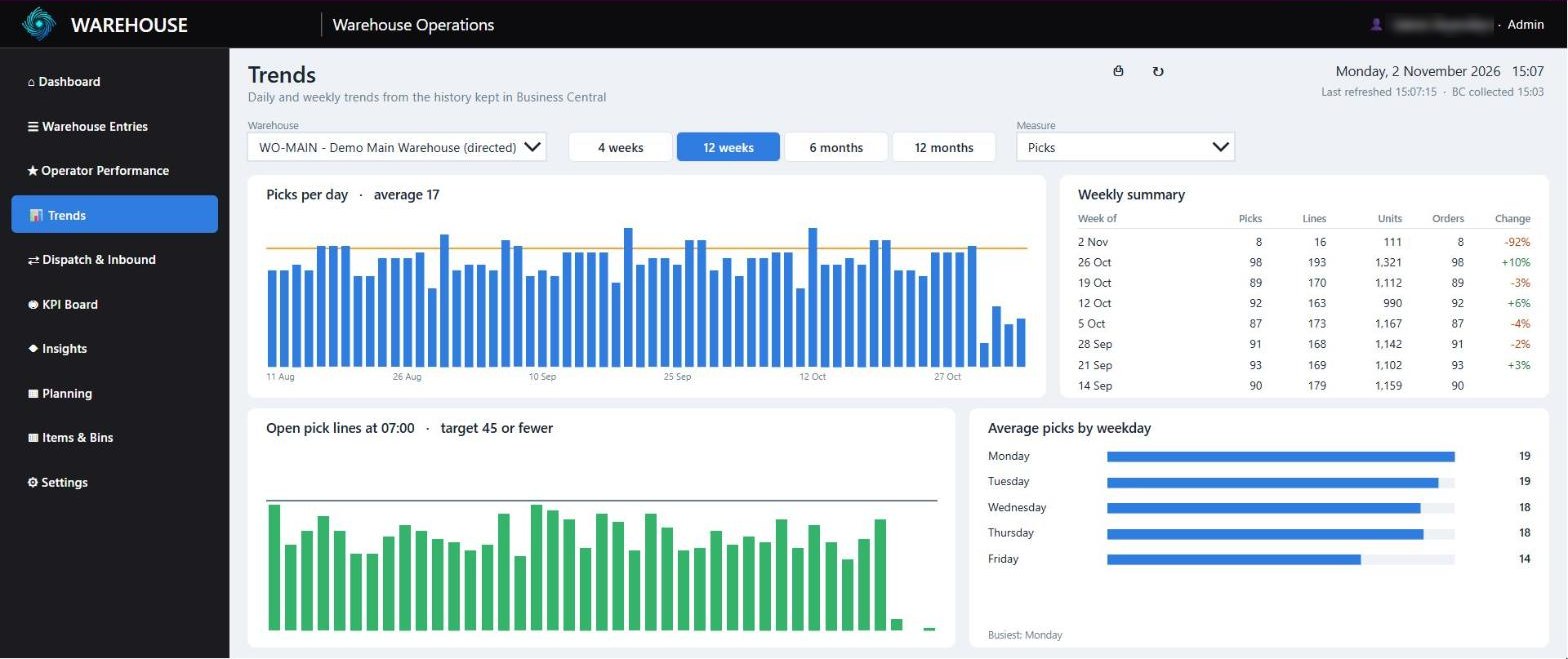
Trends
| Number | How it is calculated |
|---|---|
| Per day / per week chart | The chosen measure for each day (4 and 12 weeks) or each week (6 and 12 months). The orange line is the average over the period, also shown in the title. |
| Weekly summary | Picks, lines, units and orders per week, the latest 8 weeks, with the change in picks against the week before, as a %. |
| Open pick lines at snapshot time | Each day, Business Central records the open pick lines at the snapshot time (for example 7:00). The chart compares them with the open work target: green bars at or below the target, red above. Fewer is better: it means yesterday's work was finished. |
| Average by weekday | For each working weekday: the total for that weekday / the number of those weekdays with activity in the period. The busiest weekday is named under the chart. |
7.1 Flow measures (Enterprise)
| Number | How it is calculated |
|---|---|
| On-time % | Shipped orders that were on time / all shipped orders x 100. An order is on time when its last shipment was posted on or before its due date and, when it shipped on the due date and a courier cut-off is set, by the cut-off. |
| Cycle hours | The average time from the sales order being created to its last shipment being posted, in hours. |
| Dock-to-stock min | The average time from a receipt being posted to the last put-away of it being registered, in minutes. |
Example: an order created at 08:00, first picked at 10:30 and shipped at 11:15 has a cycle time of 3.25 hours. A receipt posted at 09:10 and put away at 11:40 has a dock-to-stock time of 150 minutes.
8. Dispatch & Inbound
Dispatch & Inbound (Professional) shows what must go out today, what is due in, and every alert. It is worked out live from Business Central sales and purchase orders each time the screen loads. Section 1.4 explains what counts as due, late, expected and overdue.
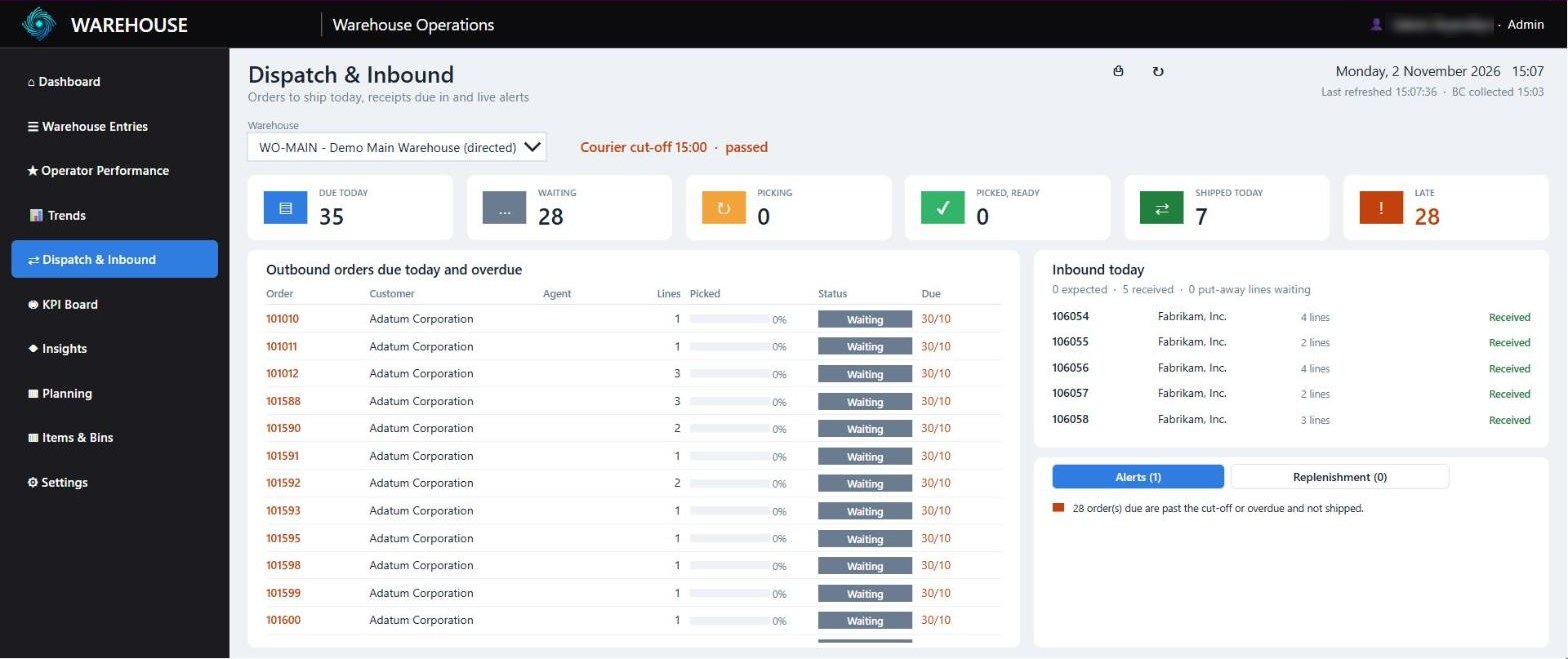
Dispatch & Inbound
8.1 Courier cut-off and tiles
The top line shows the courier cut-off and the time left, for example Courier cut-off 15:00 · 1 h 20 min left. After the cut-off it shows passed in red. Without a cut-off it shows No courier cut-off set. When shipments or receipts were undone today, a red note says how many lines were undone.
| Number | How it is calculated |
|---|---|
| Due today | Due orders: sales orders with item lines still to ship whose shipment date is today or earlier, plus orders shipped in full today. |
| Waiting | Due orders with no pick yet. |
| Picking | Due orders with a pick open or partly picked. |
| Picked, ready | Due orders fully picked but not yet shipped. |
| Shipped today | Orders shipped in full today. |
| Late | Due orders not shipped that have an open line due before today, or are still open after the cut-off. |
8.2 Outbound orders
The outbound list shows each due order: Order, Customer, Agent (shipping agent), Lines, Picked (quantity picked / quantity to ship, as a bar and %), Status and Due (today or the date it was due). Late orders come first and show in red, then Waiting, Picking, Picked and Shipped.
8.3 Inbound today
The inbound card lists purchase orders with item lines expected today or earlier, and orders received today. The line at the top counts the orders expected and received, the put-away lines waiting (put-away lines created but not yet registered) and, with flow KPIs on, the receipts over the dock-to-stock target (received but not put away within the target, default 240 minutes).
| Status | Meaning |
|---|---|
| Expected | Nothing received yet. |
| Partly received | Some lines or quantities received; more to come. |
| Received | Received in full today. |
| · overdue | Added in red when an open line's expected receipt date is before today. |
8.4 Replenishment (Enterprise)
The Replenishment tab, next to Alerts, lists pick bins that need stock: bins in pick zones where the quantity is below the bin's minimum, or zero in a fixed bin. Empty bins come first. Each line shows the bin, item, quantity against the minimum and the quantity to replenish, or no reserve when there is no stock of the item in the warehouse's other bins.
Quantity to replenish = maximum quantity - quantity (or minimum - quantity when the bin has no maximum). Example: minimum 20, maximum 100, quantity 8: replenish 92.
8.5 Alerts and their rules
Alerts are checked each time this screen or the Dashboard loads. Critical alerts are listed first (red), then warnings (orange). Each warehouse uses its own alert settings when it has them (section 13.5).
| Alert | When it shows | Severity |
|---|---|---|
| Pick open too long | A pick (or inventory pick) still has lines to pick more than X minutes after it was created. X is Alert: pick open (default 60 min; 0 turns it off). The alert names the pick, how long it has been open and who it is assigned to. | Warning; critical after 2 x X |
| No picks | No pick registered at a location for Y minutes while pick lines are waiting there. Y is Alert: no picks for (default 20 min; 0 turns it off). Only checked on working days during working hours; the count starts at the working-day start. | Warning |
| Open work high | Open pick lines at a location are above the open work target. | Warning |
| Orders late | "n order(s) due are past the cut-off or overdue and not shipped." | Critical |
| Purchase orders overdue | "n purchase order(s) are overdue and not received." | Warning |
| Pick bins to replenish (Enterprise) | Pick bins below their minimum or empty (section 8.4). | Warning; critical when a bin is empty |
| Logins without a name | Scanner logins with activity in the last 7 days that are not on the scanner-to-person list. Assign them in Settings (section 14.1). | Warning |
9. KPI Board
The KPI Board (Professional) is the day at a glance in traffic lights: green on target, amber close, red needs attention. It can also rotate on the TV. Choose the warehouse and the date like on the Dashboard.
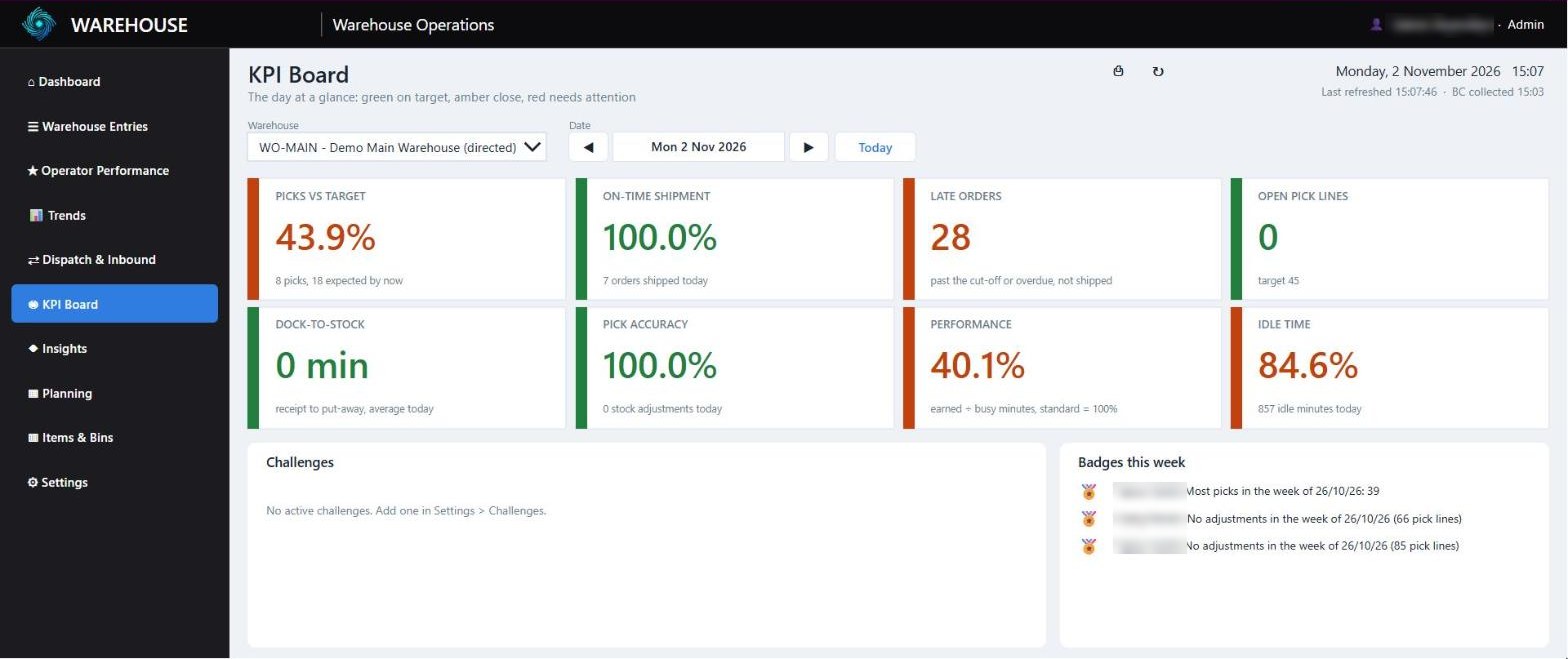
The KPI Board
9.1 The KPI tiles
Each tile shows the value in its colour, with a short line under it. A tile only shows when its feature is on, and a live figure (late orders, open pick lines) only has a value for today.
| KPI | How it is calculated | Green / amber (default) |
|---|---|---|
| Picks vs target | Picks / picks expected by now x 100 (the pace marker of section 3.2). On a past day: picks / daily target. | 100 / 85 |
| On-time shipment (Enterprise) | On-time orders / orders shipped on the day x 100 (section 7.1). | 98 / 95 |
| Late orders | Late and not shipped, as on Dispatch & Inbound. Today only. | 0 / 3, lower is better |
| Open pick lines | Open pick lines now, compared as a % of the open work target. Today only. | 100% / 125% of target, lower is better |
| Dock-to-stock (Enterprise) | The average dock-to-stock minutes of receipts put away on the day. | 240 / 360, lower is better |
| Pick accuracy | (Pick lines - adjustment lines) / pick lines x 100, all operators on the day. | 99.5 / 99 |
| Performance (Enterprise) | Earned minutes / busy minutes x 100, all operators on the day. | 100 / 85 |
| Idle time (Enterprise) | Idle minutes / time between first and last task x 100, all operators on the day. | 10 / 20, lower is better |
When higher is better, a tile is green at or above Green at, amber at or above Amber at, and red below. When lower is better it is the other way round. A manager changes the limits in Settings > KPI limits (section 13.4).
Example: at 11:00, 92 picks against 100 expected = 92%: amber (at least 85, below 100).
9.2 Challenges and badges (Enterprise)
- Challenges lists the challenges running on the chosen date, with a progress bar: progress / target and the end date. A team challenge adds up everyone's work; an individual challenge shows the leading person and their total. The bar turns green when the target is reached. Example: a team challenge of 5,000 picks with 3,250 so far shows 65%.
- Badges this week lists the badges won in the 7 days up to the chosen date (section 6.3).
10. Insights
Insights (Professional) shows what picking costs, when it peaks and how accurate it is. Choose the period: Today, This week (from Monday), This month (from the 1st), Last 4 weeks, Last 12 weeks or Last 6 months. All periods end today.
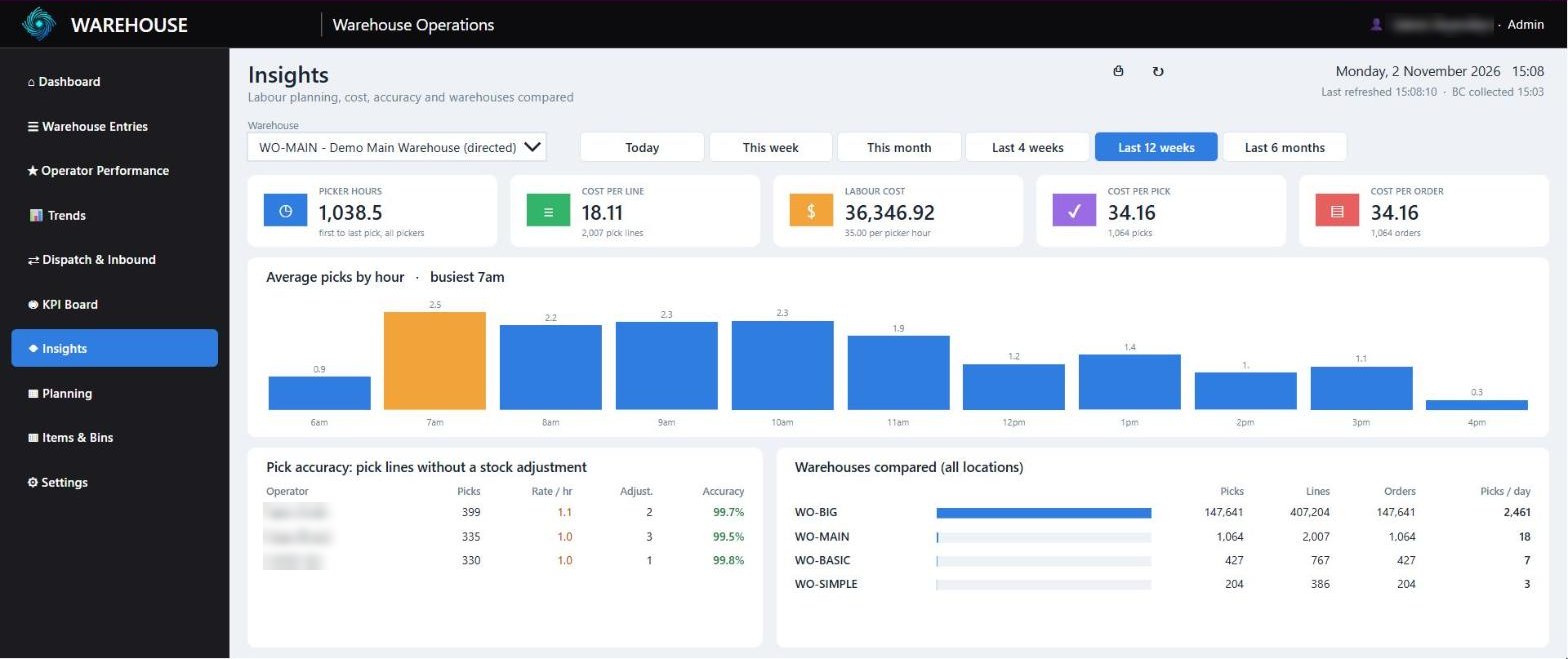
Insights (labour cost shows for Managers and Admins)
10.1 Picker hours and labour cost
Costs are based on picker hours: the time each picker was actually picking. For each picker and each day, that is the time from their first to their last pick, at least 15 minutes (0.25 h). The picker hours of all pickers and all days in the period are added up.
Labour cost = picker hours x labour cost per picker hour. The labour cost per picker hour is the cost of one picker for one hour, including wages and on-costs (for example super, payroll tax and leave loading). Your manager sets it in Settings > Targets.
Example: 3 pickers are each active for 2 hours = 6 picker hours. At $35 per picker hour, the labour cost is 6 x $35 = $210.
10.2 The tiles
| Number | How it is calculated |
|---|---|
| Picker hours | For each picker and day: last pick time - first pick time, at least 0.25 h. Added up over all pickers and days in the period. |
| Cost per line | Labour cost / pick lines in the period. |
| Labour cost | Picker hours x labour cost per picker hour. The line under it shows the rate used, for example 35.00 per picker hour. |
| Cost per pick | Labour cost / picks in the period. |
| Cost per order | Labour cost / orders picked in the period (different source orders with picks, counted once per day). |
Cost figures are only shown to Managers and Admins; everyone else sees —. The cost tiles show – when the labour cost per picker hour is 0. Labour cost only counts the time between first and last picks; it is not the payroll cost of the whole shift.
10.3 Charts and tables
| Number | How it is calculated |
|---|---|
| Average picks by hour | Picks in each working hour / days with picks in the period. The busiest hour is highlighted in orange and named in the title. (The average by weekday is on Trends.) |
| Pick accuracy | For each person: picks, pick rate (green at or above the target, orange from 80% of it, red below), stock adjustment lines and accuracy % = (pick lines - adjustment lines) / pick lines x 100. Accuracy is green at 99.5% or more, orange from 99%, red below. |
| Warehouses compared | For each location: picks (with a bar), pick lines, orders and picks per day = picks / working days in the period. |
Planning for the coming days (expected picks and pickers needed) is on the Planning screen (chapter 11).
11. Planning
Planning (Professional) estimates the work for a week, day by day, and how many pickers you need. It uses your own history (the same weekday in recent weeks) plus the sales order lines already due. It opens on next week.
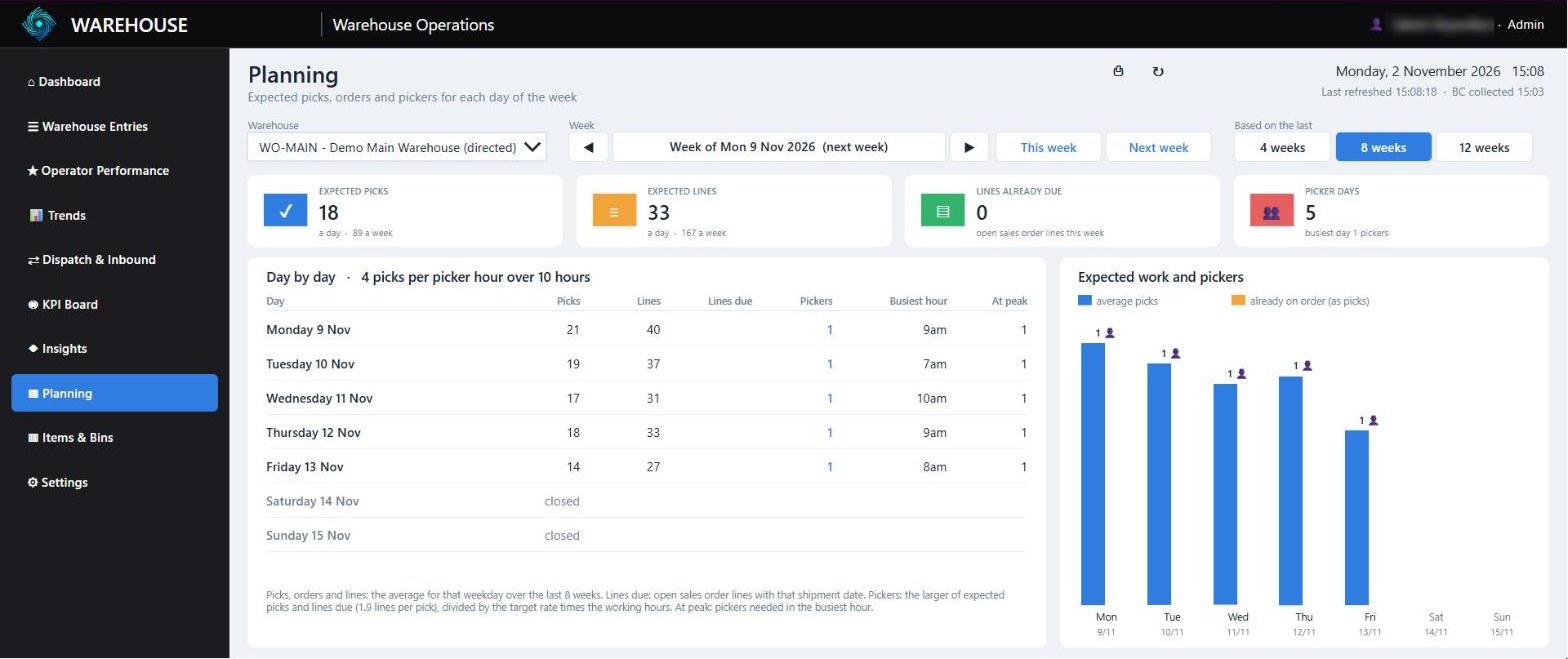
Planning
11.1 Choosing the week and the basis
- ◀ and ▶ move one week back or forward. This week and Next week jump straight there. The heading shows Week of the Monday.
- Based on the last 4 / 8 / 12 weeks (default 8) chooses how much history the averages use. The basis ends yesterday. 4 weeks follows recent changes quickly; 12 weeks smooths out unusual weeks.
11.2 The four cards
| Number | How it is calculated |
|---|---|
| Expected picks | The average per working day: the expected picks of the week / the working days in the week. The line under it adds · N a week, the week total. |
| Expected lines | The same for pick lines: average per working day, and · N a week. |
| Lines already due | Open sales order lines (still to ship) with a shipment date in that week. |
| Picker days | The pickers needed on each day, added up. For example 1 + 2 + 1 + 1 + 1 = 6 picker days. The line under it shows the busiest day's pickers. |
11.3 The day-by-day table
| Number | How it is calculated |
|---|---|
| Picks, Lines | The average for that weekday over the basis weeks. For example, Monday picks = picks on the Mondays in the basis weeks / the number of those Mondays with picks. Non-working days show closed. |
| Lines due | Open sales order lines with that shipment date. |
| Pickers | RoundUp( the larger of expected picks and (lines due / lines per pick), divided by (pick rate target x working hours) ). Lines per pick = pick lines / picks over the basis weeks; it turns lines due into picks. |
| Busiest hour | The hour with the highest average picks on that weekday. |
| At peak | RoundUp( average picks in the busiest hour / pick rate target ): the pickers needed to keep up in that hour. |
Worked example: Monday has 21 expected picks. The pick rate target is 4 picks per hour and the working day is 10 hours. One picker can do 4 x 10 = 40 picks in a day, so 21 / 40 = 0.53, rounded up to 1 picker. If 120 lines were already due on Monday at 2 lines per pick, that is 60 picks; 60 / 40 = 1.5, so 2 pickers.
The chart Expected work and pickers shows each day as bars: blue = average picks, orange = already on order (lines due shown as picks). The label above each day is the number of pickers.
11.4 Using it for rostering
- Late in the week, open Planning on Next week, based on the last 8 weeks.
- Roster the Pickers number for each day as the minimum. Check At peak: if it is higher, plan extra help, or no breaks, around the Busiest hour.
- Look at Lines due: when the orange bar is above the blue one, more work is already on order than usual. Plan for the higher number.
- Check again the day before: new orders change Lines due and the pickers.
- Allow for what the history cannot know: public holidays, promotions, a big customer order or a stocktake.
Planning uses the pick rate target, the working hours and the working days from Settings (or the warehouse's own settings). If the target rate is too high, the pickers needed will be too low. Make sure the target is a realistic rate for one person.
12. Items & Bins
Items & Bins (Enterprise) shows which items move fastest, where they are picked from and how busy each zone is. Choose the warehouse and the period: 4 weeks, 13 weeks (default) or 26 weeks. The period starts on a Monday and runs to today.
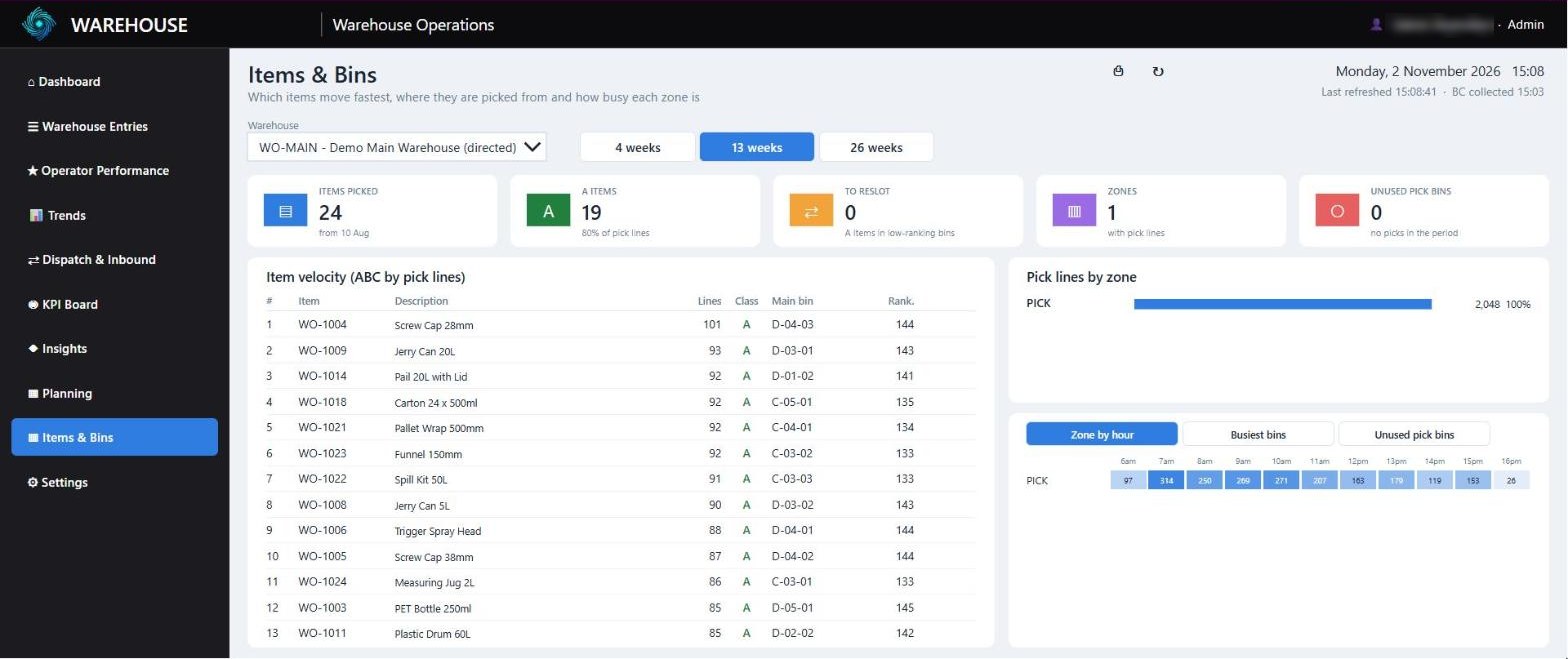
Items & Bins
12.1 The tiles
| Number | How it is calculated |
|---|---|
| Items picked | Different items with pick lines in the period, and the start date. |
| A items | Items in class A: the fastest movers that together make up 80% of all pick lines. |
| To reslot | A items whose main pick bin has a low bin ranking (section 12.2). |
| Zones | Zones with pick lines in the period. |
| Unused pick bins | Pick bins with no pick lines in the period. |
12.2 Item velocity (ABC)
The table lists the items with the most pick lines (up to 150), busiest first: #, Item, Description, Lines, Class, Main bin, its bin ranking (Rank.) and reslot in red for a reslotting candidate.
- Running down the list, items up to 80% of all pick lines are A (green), up to 95% are B (orange), the rest are C.
- The main bin is the bin an item is picked from most.
- A reslotting candidate is an A item whose main bin has a bin ranking in the lowest third of the warehouse's pick bins. In Business Central a higher bin ranking is picked first, so a fast mover in a low-ranking bin costs walking time.
Example: 10,000 pick lines in total. The top 40 items have 8,000 lines (80%): A. The next 100 items bring it to 9,500 (95%): B. All others: C.
12.3 Zones and bins
- Pick lines by zone: the pick lines in each zone, as a bar, with the % of all pick lines.
- Zone by hour: a grid of pick lines per zone per working hour for the 8 busiest zones. Darker cells mean more lines.
- Busiest bins: the 15 bins with the most pick lines.
- Unused pick bins: pick bins with no pick lines in the period, with their bin ranking. These are candidates to free up or to give to faster items.
13. Settings
Settings is for Supervisors, Managers and Admins (section 1.6). The left side has lists; the right side has the app settings on tabs. What you see depends on your role and your plan. Everything is saved in Business Central and applies to everyone, including running TVs, at their next refresh.
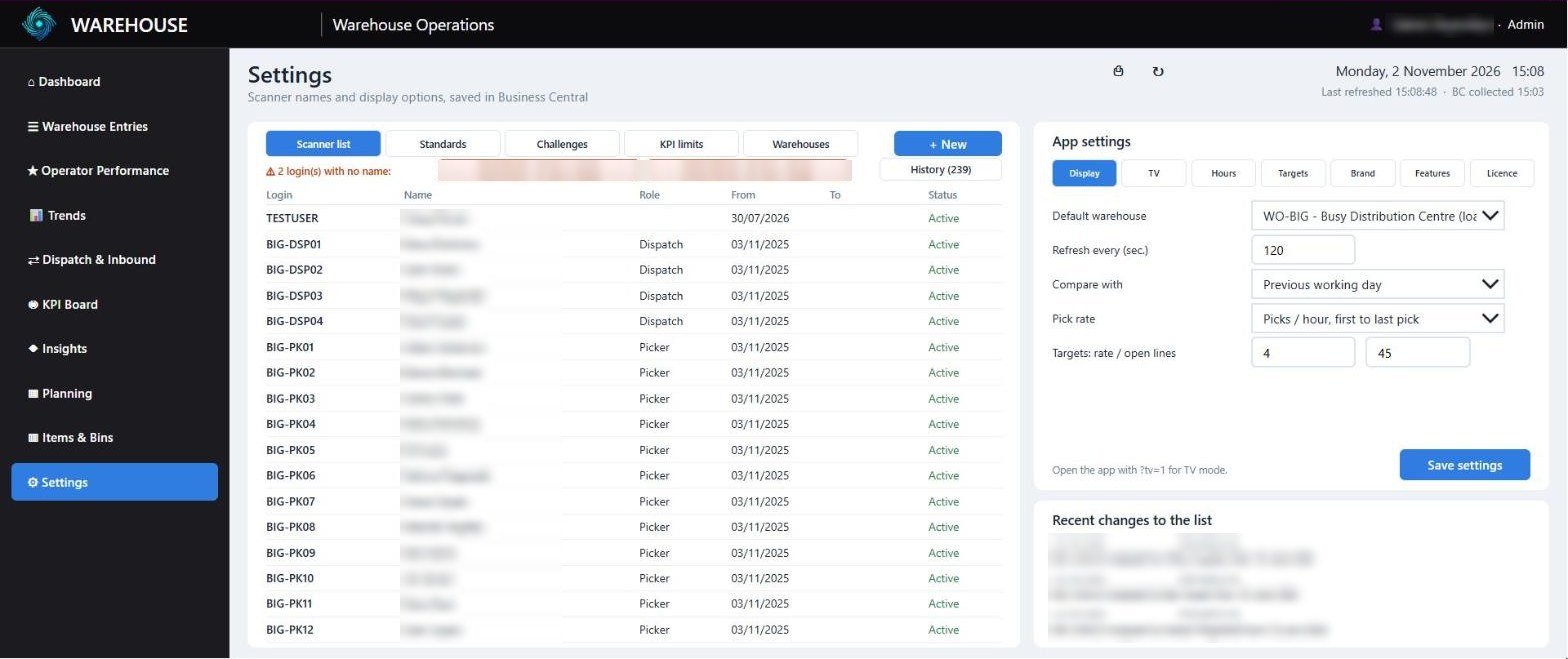
Settings: the scanner list on the left, app settings on tabs on the right
| Part | Who sees it | What it holds |
|---|---|---|
| Scanner list (left) | Supervisor and up | Who uses which login, from when, and their role (chapter 14). |
| Standards (left) | Manager and up; task standards on (Enterprise) | Task standards and Calibrate from last 4 weeks (section 13.3). |
| Challenges (left) | Supervisor and up; challenges on (Enterprise) | Team and individual targets between two dates (section 13.6). |
| KPI limits (left) | Manager and up; KPI Board on (Professional) | Green and amber limits, for all roles or per role (section 13.4). |
| Warehouses (left) | Manager and up; warehouse settings on (Enterprise) | A warehouse's own hours and targets (section 13.5). |
| Display, TV, Hours, Targets (right) | Manager and up | Section 13.1 and 13.2. |
| Brand, Features, Licence (right) | Admin | Section 13.7 to 13.9. |
On the right-hand tabs, change the values and choose Save settings. Supervisors see a note that these settings are changed by a manager or admin.
13.1 Display, Hours and Targets
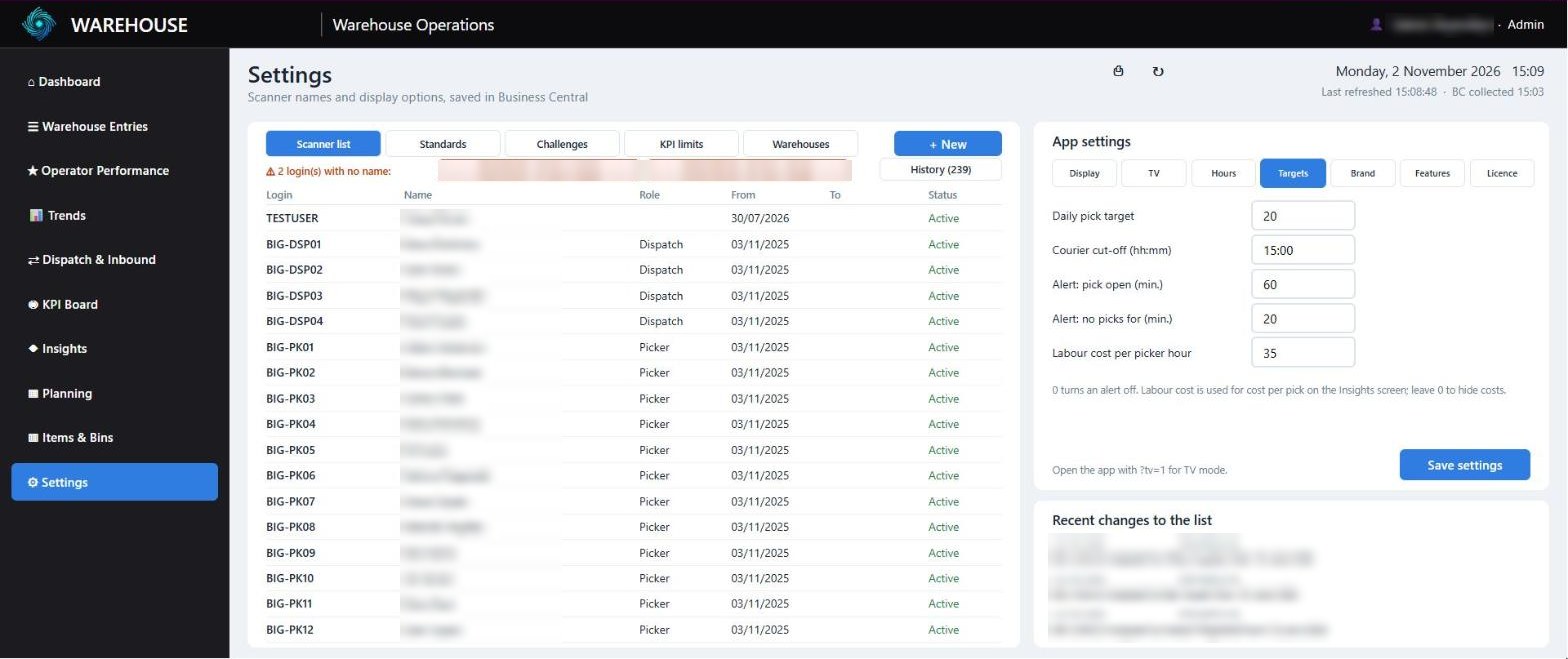
Settings > Targets
Display
| Setting | What it does |
|---|---|
| Default warehouse | The warehouse the app opens on (unless the link has loc=). |
| Refresh every (sec.) | How often each screen reloads on its own. At least 30 seconds; default 120. |
| Compare with | Previous working day or Same day last week, for the % on the Dashboard tiles. |
| Pick rate | Picks / hour, first to last pick (default), Picks / hour of the day or Lines / hour, first to last pick (section 5.4). |
| Targets: rate / open lines | The pick rate target each person aims for, per hour (used for the bars and markers, the status, badges and Planning), and the open work target: the most open pick lines you want (Trends, alerts, KPI Board). |
Hours
| Setting | What it does |
|---|---|
| Open from / to (hh:mm) | The working day. Outside it the app pauses auto refresh and the TV rotation (section 2.6). Business Central collects from 30 minutes before to 60 minutes after. |
| Working days | A switch for each day, Monday to Sunday. |
| Collect around the clock | Business Central collects every minute, day and night, and the app always refreshes. |
| Pause auto refresh | The app stops refreshing by itself and the TV stops rotating, until it is turned off. The refresh button still works. |
The line under the switches says what is happening now, for example Open now: refreshes every 120 sec. until 16:00.
Targets
| Setting | What it does |
|---|---|
| Daily pick target | Picks the warehouse aims to finish in a working day (Dashboard target bar, KPI Board). |
| Courier cut-off (hh:mm) | Orders due today and not shipped by then count as late. Blank: no cut-off. |
| Alert: pick open (min.) | Default 60. 0 turns the alert off. |
| Alert: no picks for (min.) | Default 20. 0 turns the alert off. |
| Labour cost per picker hour | The cost of one picker for one hour, including wages and on-costs. Labour cost on Insights = picker hours x this rate (section 10.1). 0 hides costs. |
13.2 TV
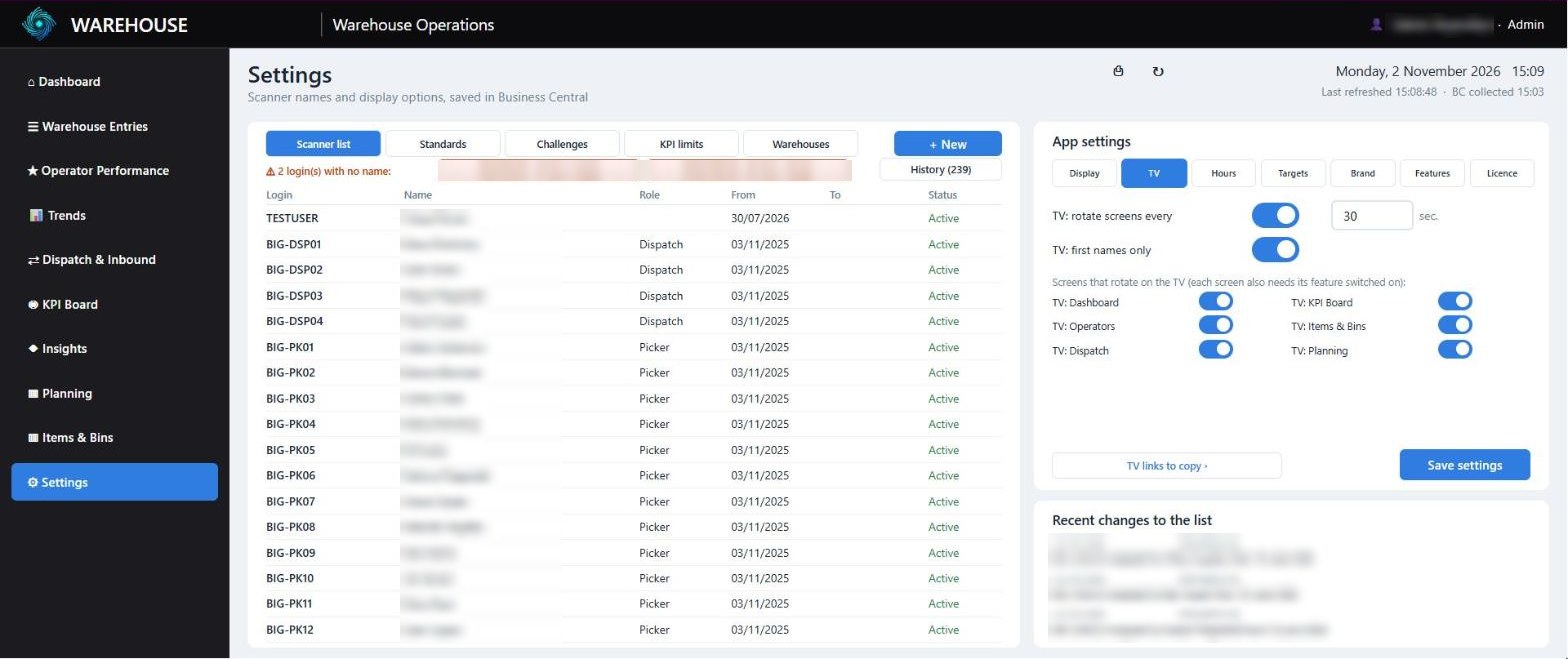
Settings > TV
| Setting | What it does |
|---|---|
| TV: rotate screens every | Turns TV rotation on and sets the seconds per screen (default 30). |
| TV: first names only | Shows first names on the TV instead of full names. |
| Screens that rotate on the TV | A switch for each screen: TV: Dashboard, TV: Operators, TV: Dispatch, TV: KPI Board, TV: Items & Bins and TV: Planning. A screen also needs its feature switched on. |
| TV links to copy › | Opens the TV links on the left (section 15.2). |
13.3 Standards and calibration (Enterprise)
The Standards list shows each task standard: Activity, Location and Zone (blank = all), Sec./line and Sec./doc. Change a number and it is saved straight away. A change makes Business Central recalculate the last 90 days of statistics in the background at its next collection.
Calibrate from last 4 weeks sets the standards from your own work, so that a typical person scores about 100%:
- For each person and day, the busy minutes are shared over the activities they did, in proportion to the time each activity earned under the current standards.
- For each warehouse and activity, the standard is multiplied by busy minutes / earned minutes over the last 4 complete weeks up to yesterday.
- An activity is only calibrated when it has at least 10 hours of earned time at that warehouse. The new standards are saved for that warehouse, and the app shows what changed.
Example: pickers at MAIN earned 300 hours under the standards but were busy for 360 hours. The pick standards at MAIN are multiplied by 360 / 300 = 1.2: 30 s per line becomes 36 s. A typical picker then scores 100% instead of 83%.
Calibrate is for Managers and Admins and needs task standards switched on. The last 90 days of statistics are recalculated in the background after calibrating.
13.4 KPI limits
The KPI limits list shows each KPI with Green at and Amber at, and whether higher or lower is better. Change a number and it is saved straight away. These limits colour the KPI Board and the bars and status on Operator Performance.
- The role picker at the top chooses All roles (main limits) or one role: Pickers, Receivers, Put-away or Dispatch.
- With a role chosen, a changed number becomes that role's own limit (marked own limit). Everything the role has no own limit for uses the main limits.
- People get their role from the scanner-to-person list (chapter 14). People without a role use the main limits.
Example: the main Picks vs target limits are 100 / 85. For Receivers you set green at 60 and amber at 40, because receivers only pick now and then. A receiver at 70% of the pick rate target is green; a picker at 70% is red.
13.5 Warehouses (Enterprise)
Each warehouse can have its own settings. Choose the warehouse in the picker at the top and + New; only warehouses without their own settings are in the picker. The columns are Start, End, Picks/day (daily pick target), Rate/hr (pick rate target), Open lines (open work target) and Cut-off. Blank or 0 uses the main setup. ✕ removes the warehouse's own settings.
The app uses the chosen warehouse's values. All warehouses uses the main setup. Alerts and Dispatch & Inbound use each warehouse's own values. Warehouse settings must be switched on under Features.
13.6 Challenges (Enterprise)
+ New adds a challenge (100 picks over the next 7 days, as a start). Set the Name, Measure (Picks, Lines, Units or Orders), Target, From and To dates and whether it is a Team or Individual challenge. Changes are saved straight away; ✕ deletes the challenge. Running challenges show on the KPI Board and the TV (section 9.2).
13.7 Brand (Admin, Professional)
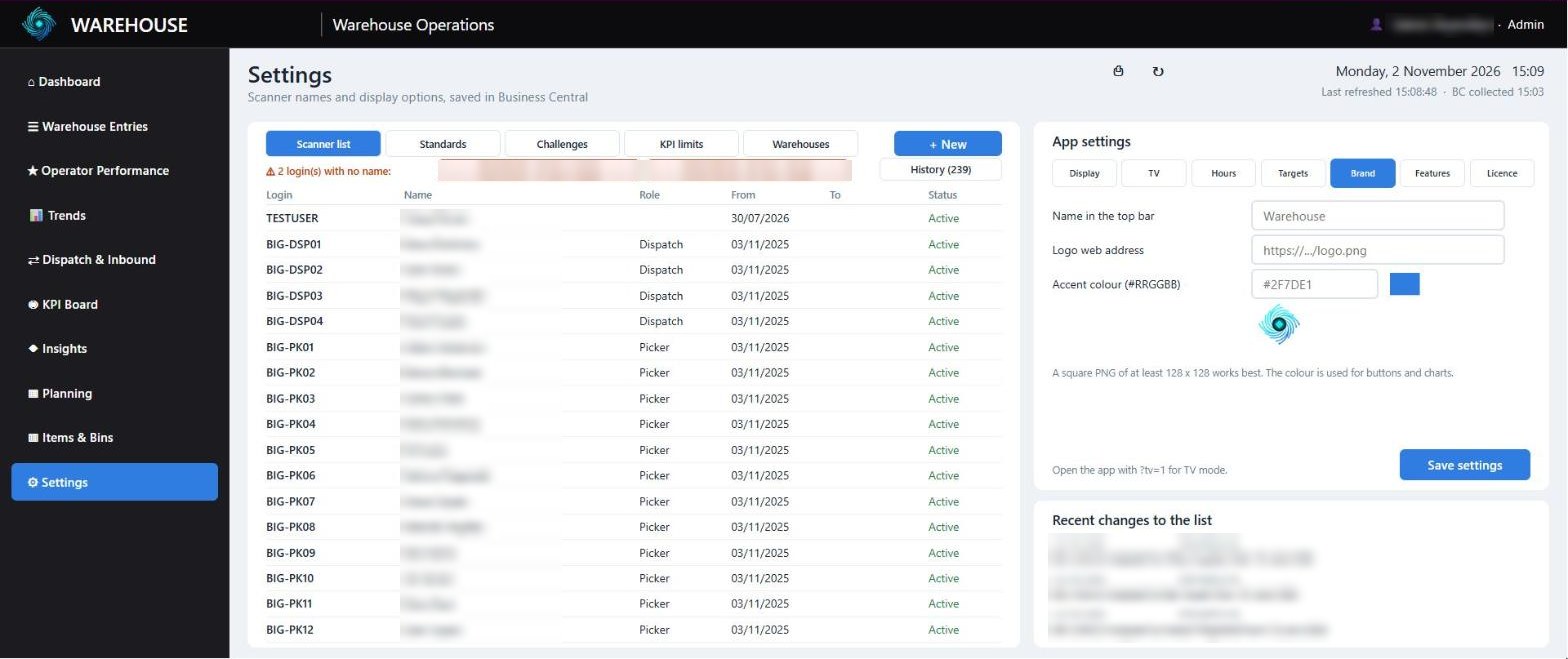
Settings > Brand
| Setting | What it does |
|---|---|
| Name in the top bar | For example your company or warehouse name. |
| Logo web address | The web address of a square PNG logo, at least 128 x 128 pixels. Blank shows the standard logo. |
| Accent colour (#RRGGBB) | The colour for buttons and charts, for example #2F7DE1. |
13.8 Features (Admin)
Every feature can be switched off. When a switch is off, the app hides the screen, tile, column or menu item, and Business Central skips the calculation. A switch your plan does not include shows the plan name and cannot be turned on.
| Switch | Controls | Plan |
|---|---|---|
| Idle time | Idle tile, idle bars, idle on the profile, the Idle time KPI. | Enterprise |
| Task standards | Earned minutes and performance % everywhere; Settings > Standards. | Enterprise |
| Badges | Badge awards. | Enterprise |
| Challenges | Challenges in Settings, on the KPI Board and the TV. | Enterprise |
| Coaching notes | Coaching notes on the operator profile. | Enterprise |
| Flow KPIs | On-time %, cycle time and dock-to-stock (Trends, KPI Board, Inbound). | Enterprise |
| KPI Board | The KPI Board, KPI limits, status colours and accuracy on Operator Performance. | Professional |
| Items & Bins | The Items & Bins screen. | Enterprise |
| Replenishment | The replenishment list and its alert. | Enterprise |
| Warehouse settings | Per-warehouse settings (off: the main setup for every warehouse). | Enterprise |
| Dispatch & Inbound, Insights, Planning | Those screens. | Professional |
The same tab has Idle gap (min.) (default 10, section 5.5) and Dock-to-stock (min.), the dock-to-stock target (default 240).
13.9 Licence (Admin)
The Licence tab shows the Status, Plan, Licensed to, Companies (All companies in this tenant), Valid until (with the days left), Licence ID and Tenant ID. To renew or change the plan, send the tenant ID to Future Ledger AI. Paste the new key you receive into New licence key and choose Apply key. One key covers every company and every warehouse in your Business Central tenant.
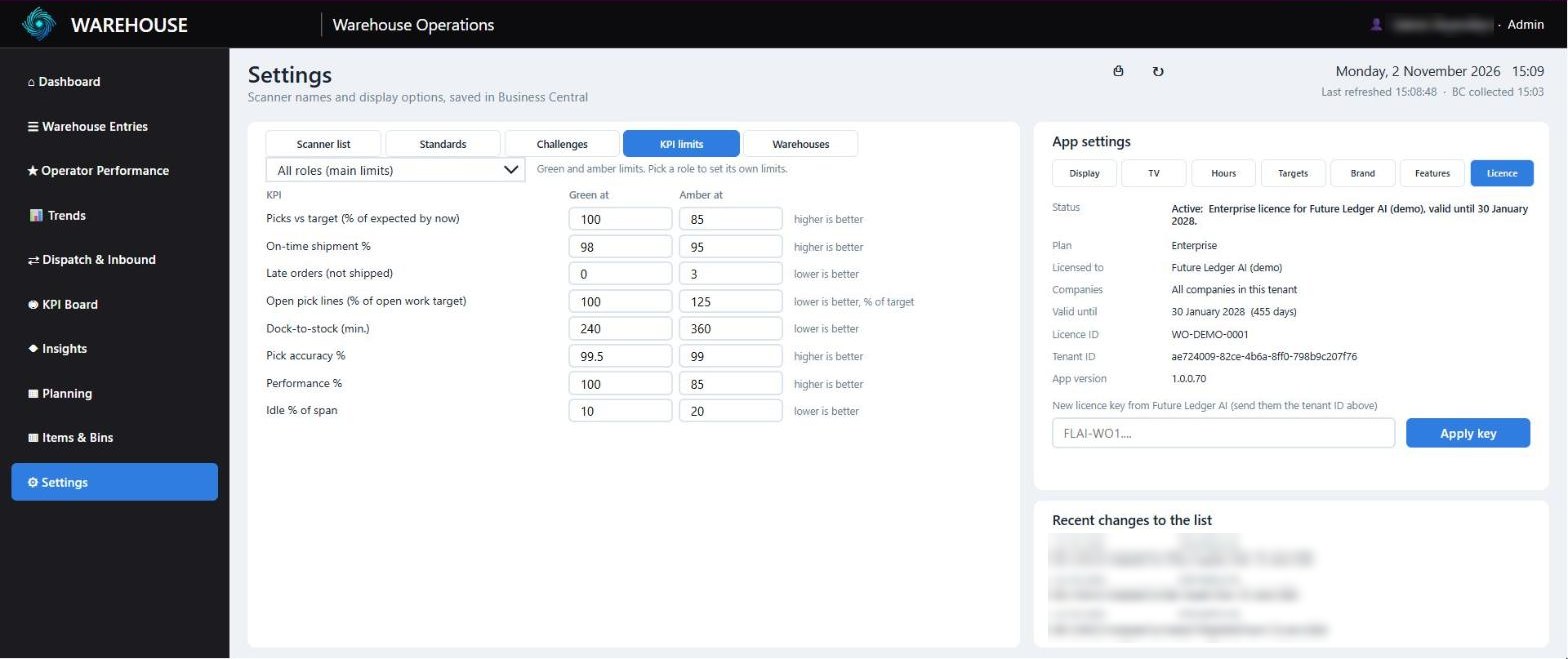
Settings > Licence, next to the KPI limits list
14. The scanner-to-person list
Scanners often sign in to Business Central with shared logins such as SCANNER01. The scanner-to-person list says who used each login, from when to when, and in what role, so the app shows people's names and judges each person against the right limits. It is in Settings > Scanner list in the app (Supervisor and up), and in Business Central on the Warehouse Operators page.
| Field | Meaning |
|---|---|
| Login | The Business Central user name the work is registered under, for example SCANNER01. Choose it from the list read from Business Central (its warehouse employees and the logins already on the list). |
| Name | The person's name shown in the app and reports. |
| First name (TV) | The name on the TV when first names only is on. |
| Role (KPI limits) | Picker, Receiver, Put-away, Dispatch or none. The role chooses the KPI limits the person is judged against (section 13.4). |
| From | The first day this person uses the login. |
| To | The last day this person uses the login. Leave blank while they still use it. |
| Spare | Nobody uses the login in this period. Its work shows under the login instead of a name. |
14.1 Add a person to a login
- In the app, open Settings > Scanner list and choose + New.
- Choose the Login and enter the Name and the First name (TV).
- Choose the Role.
- Enter the From date (dd/mm/yyyy). Leave To blank (blank means still using).
- Choose Save.
When logins have activity but no name, a red line above the list says n login(s) with no name, with a chip for each login and its number of lines. Choose the chip (Assign) to start a new entry for that login, with From set to the first day it was used.
One person per login at a time. If the login is already assigned to someone for those dates, the app warns you as soon as you choose it and Save stays off. Put an end date on the other person's line first. Nothing is ended automatically, so a mistyped login cannot take a scanner from someone.
14.2 When someone stops using a login
- Choose the person's line in the list.
- Choose End today (moves to History), or enter the last day in To and choose Save.
- Add a new line for the next person with From set to their first day, or a line with Spare on if nobody takes the login over.
The list shows active lines. Ended lines move to History (n); they are kept so past activity keeps the right names, and you can still choose one to correct it. Delete asks for a second click (Confirm). The Status column shows Active, Ended or Spare.
Names follow the dates. Work done before a person's From date, or after their To date, does not get their name. Saving updates the names on past activity from the list. Every change is kept in Recent changes to the list (and the Change Log in Business Central): who changed what and when.
15. TV mode
15.1 How TV mode works
With tv=1 in the link (section 2.3), the app runs in TV mode:
- No menu, no print button and no role in the top bar; the screens use the full width.
- It rotates through the screens switched on under Settings > TV, in this order: Dashboard → Operator Performance → Dispatch & Inbound → KPI Board → Items & Bins → Planning, each for the time set in TV: rotate screens every (default 30 seconds). By default the first four are on. With only one screen switched on, the TV stays there.
- Each screen reloads its figures every time it comes round, so the TV is always current.
- With rotation off, the TV stays on the Dashboard and refreshes at the refresh interval.
- Outside open hours, or while Pause auto refresh is on (section 2.6), rotation and refresh pause and the header says so. Add &always=1 to the link to keep the TV rotating outside open hours.
- Names are shown without logins; with TV: first names only on, only first names.
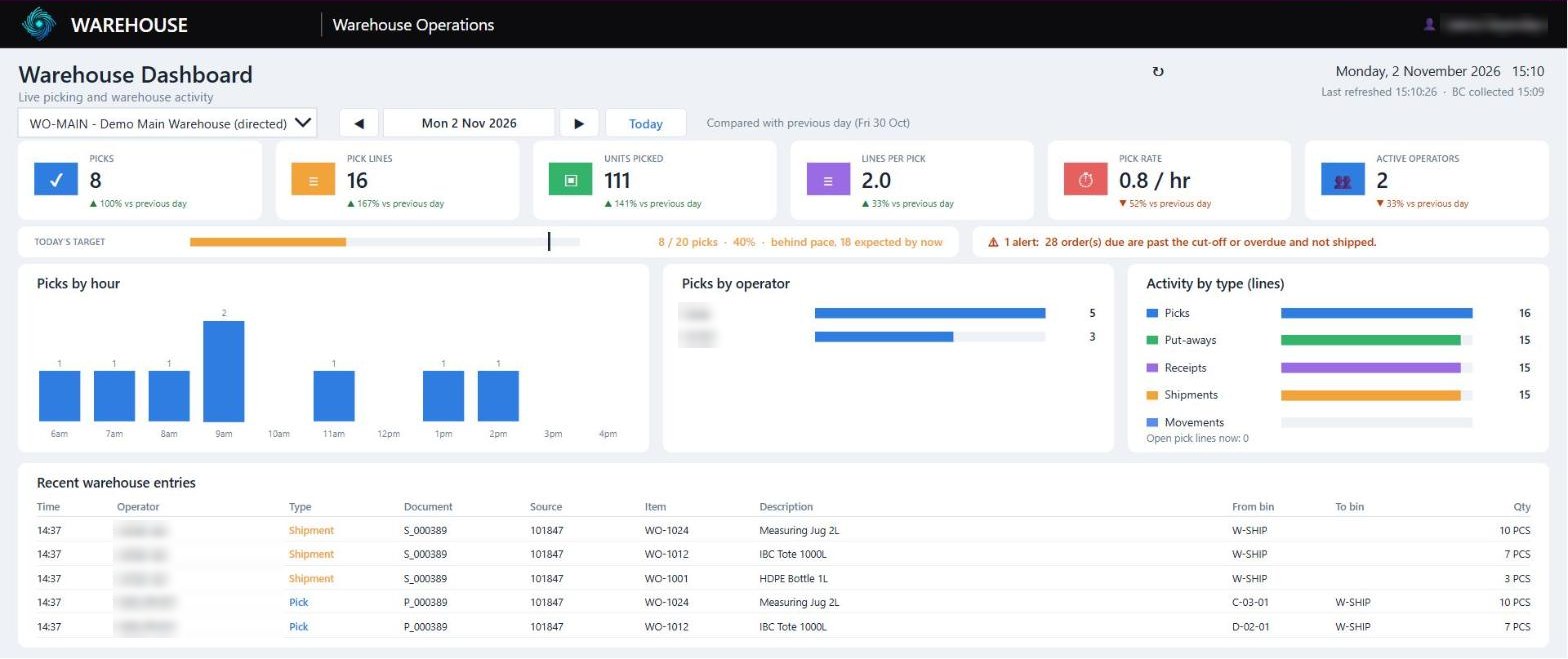
TV mode
15.2 TV links per warehouse
A manager gets a ready-made link for each warehouse in Settings > TV > TV links to copy ›:
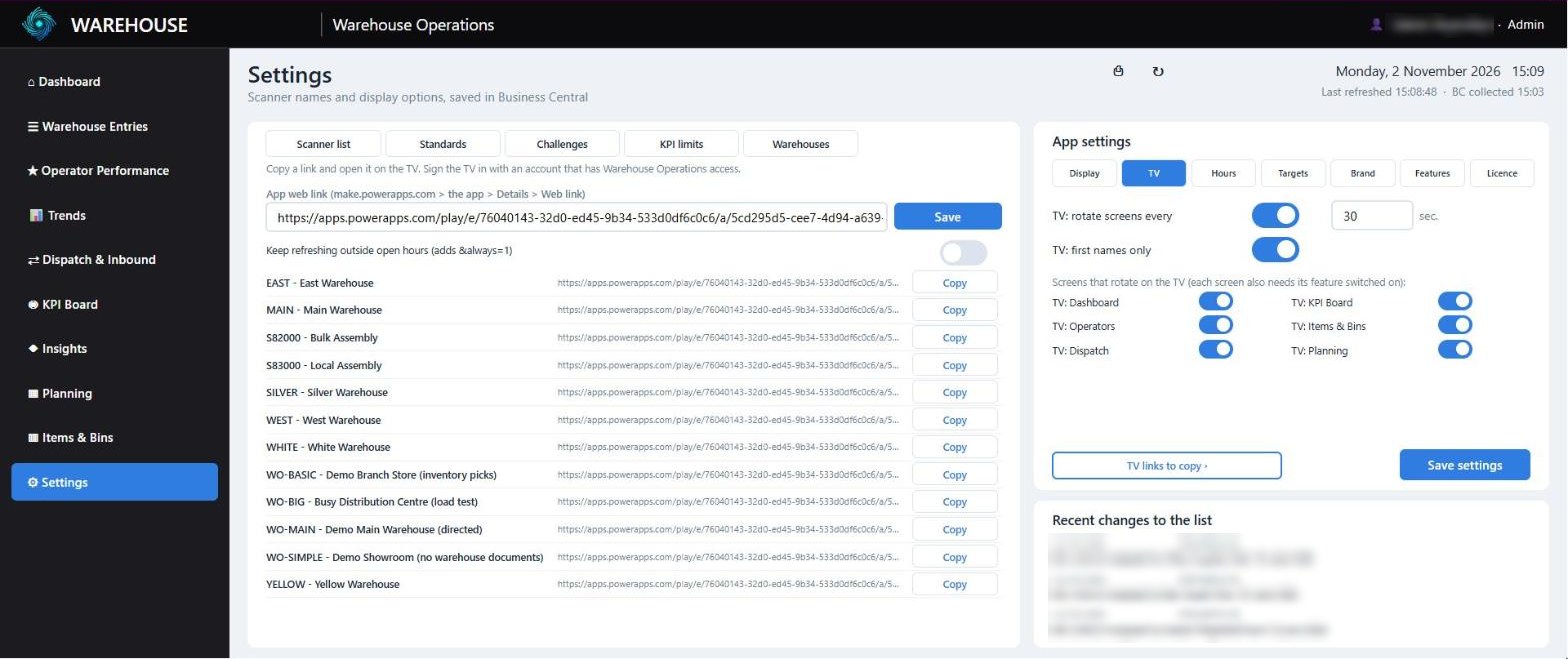
TV links to copy: one link per warehouse
- The first time only: open the app at make.powerapps.com, choose the app, Details, and copy the Web link. Paste it into App web link and choose Save. It is saved in Business Central for everyone.
- Turn on Keep refreshing outside open hours if the TV should rotate around the clock (adds &always=1).
- Choose Copy next to the warehouse. The link is the app link plus tv=1&loc=CODE, so it opens that warehouse in TV mode.
- Open the link on the TV and sign in with an account that has the app shared and a Warehouse Operations permission set. Choose Allow the first time (and after each new app version).
Set the TV's power settings so the screen never sleeps, and turn off browser translation pop-ups. If the TV has been off overnight, it refreshes on its own when it comes back on.
16. The phone app
Warehouse Operations Mobile has four tabs at the bottom. It fits every phone size.
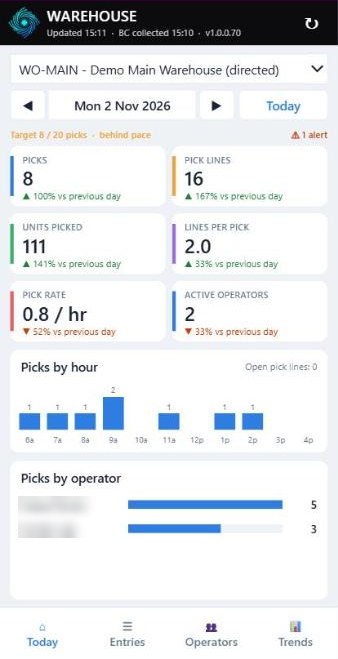
The phone app
| Tab | What it shows |
|---|---|
| Today | The day's tiles (Picks, Pick lines, Units picked, Lines per pick, Pick rate and Active operators), today's target with the pace, the number of alerts, picks by hour and picks by operator, with the same calculations as the Dashboard. |
| Entries | The day's warehouse entries, newest first, with a type filter. |
| Operators | Active operators, average and best pick rate, and the operators for the day, week or month with their pick rates. |
| Trends | Picks over time and the weekly summary. |
Use ◀, ▶ and Today to change the day, and ↻ at the top to refresh. The phone app shows the same licence and No access messages as the desktop app.
Lines per pick on the phone is pick lines divided by picks for the day, as on the desktop Dashboard.
17. Printing or saving a screen as PDF
- Open the screen and choose the warehouse, date or period you want.
- Choose ⎙ in the top bar. The browser's print window opens.
- To print, choose your printer. To save, choose Save as PDF (or Microsoft Print to PDF) as the printer.
- Set Layout to Landscape for the best fit, then choose Print or Save.
Printing is not available in TV mode or in the phone app.
18. The daily summary by email and Teams
With the Professional or Enterprise plan, and if your administrator has set it up, Business Central sends a short summary of the day once per working day, after the summary time (by default the end of the working day). It goes by email to the people on the list, to a Teams channel, or both.
| Figure | Meaning |
|---|---|
| Picks, Pick lines, Units picked, Orders picked | For the whole day and all warehouses. |
| Active operators | People with at least one pick. |
| Top operator | The person with the most picks, with their picks. |
| Receipt lines, Put-away lines | Lines received and put away. |
| Orders late, not shipped | As the Late tile on Dispatch & Inbound at the time of sending. |
| Open alerts | Alerts open at the time of sending. |
The email subject is Warehouse summary with the date. To be added to or removed from the email list, ask your administrator.
19. Where the data lives and what the app writes
19.1 Where the data is stored
- The activity history is stored in Business Central, in the extension's own table Warehouse Activity Entry. It stays in your Business Central company, with Business Central's security and backups.
- Power Apps stores nothing. The apps read from Business Central each time they load or refresh. The figures are only held in memory while the app is open, and are gone when you close it.
- Everyone sees the same figures because they all come from the same Business Central tables.
- The activity log, operator days, flows, snapshots and badges are kept for 24 months by default (Business Central Retention Policies; your administrator can change this). Coaching notes are never deleted automatically.
19.2 What the app and the extension write
Warehouse Operations writes only to its own tables:
| Own table | Written by | What it holds |
|---|---|---|
| Warehouse Activity Entry (activity log) and Sync State | The collection job | One entry per line of registered or posted warehouse work, and how far each source has been read. |
| Operator Day, Flow, Badge Award | The collection job, after each run | Each person's day (time, idle, earned minutes, performance, accuracy), order and receipt flows, and badges. |
| Open Work Snapshot | The collection job, once a day at the snapshot time | The open pick lines and unshipped order lines at that time. |
| Warehouse Operations Setup, Location Setup | Managers and admins, in Settings or in Business Central | The settings: hours, targets, alerts, TV, features, branding, licence, daily summary, and each warehouse's own settings. |
| Task Standard, KPI Threshold, Challenge | Managers (standards, limits) and supervisors (challenges) | Task standards, KPI limits (main and per role) and challenges. |
| Coaching Note | Supervisors and up, on the operator profile | Coaching notes. |
| Warehouse Operators and Operator Log | Supervisors and up, in Settings or on the BC page | The scanner-to-person list with roles, and its change log. |
It also uses standard Business Central features:
- Two job queue entries: the collection (every minute in open hours) and the daily summary.
- The daily summary emails go through Business Central's email module and appear in its email log (Sent Emails).
- The Teams summary is posted as a message to the chosen Teams channel.
Warehouse Operations never changes orders, warehouse documents, ledgers, items, customers, vendors, locations, bins or Business Central setup. Uninstalling the extension removes only its own tables. The separate Demo Data app, which does post transactions, is only used in FLAI's own sandboxes and is never installed at your company.
20. Questions and troubleshooting
| Question | Answer |
|---|---|
| Two screens show slightly different numbers. | Each screen loads its figures when it is opened and then at the refresh interval. Business Central collects new work every minute. For a minute or two one screen can be ahead of another. Choose ↻ on both and they match. |
| A banner says a new version is coming or available. | The app has been updated. Press Ctrl+F5 (or close the tab and open the link again) to load the new version. On a TV, reload the page once and choose Allow if asked. |
| The app asks me to Allow, or shows no data at all. | Choose Allow on the Business Central prompt (section 2.4). If you chose Don't allow, close the tab and open the link again. If it still shows nothing, ask your administrator to check that you have a Business Central licence, a Warehouse Operations permission set and that the app is shared with you. |
| The app says No access to Warehouse Operations. | Ask your Business Central administrator to assign you FLP WO VIEW (or a higher Warehouse Operations permission set) directly, not only through a security group (section 1.6). |
| The screen says Licence expired. | Your data is safe and still being collected. Ask your Warehouse Operations admin to enter a new licence key (section 13.9). |
| A screen I expect is not in the menu. | Your plan does not include it, or an admin has switched it off under Settings > Features (section 1.5). |
| There is no data before a certain date. | The app only shows work collected by Warehouse Operations. History goes back to the History Start Date in the setup (all history if it is blank). Until Business Central has collected activity for the first time, every screen is empty. |
| Today is empty early in the morning. | Nothing has been registered yet. Check BC collected in the top bar once work has started: it should be a minute or two ago. If it stays old while people are working, tell your administrator: the job queue may have stopped. |
| Why is an order Late when it is already picked? | Late counts every due order that is not shipped and is overdue, or still open after the courier cut-off. Picked but not shipped still counts. Once the shipment is posted, it moves to Shipped today. |
| A login shows instead of a name. | The login is not on the scanner-to-person list for that date, or is marked spare. Use the Assign chip or add the line in Settings > Scanner list (chapter 14). |
| Someone is red for pick rate, but they mostly receive. | Give them the Receiver role on the scanner-to-person list, and set the Receiver limits in Settings > KPI limits (section 13.4). |
| Everyone's performance looks too high or too low. | The task standards do not fit your warehouse yet. A manager can choose Calibrate from last 4 weeks (section 13.3). |
| Someone's pick rate looks too high or too low. | Check their first and last pick times. One or two quick picks use the 15-minute minimum; a long gap between picks (for example a break or other work) counts as active time. With idle time on, the gap shows as idle. |
| The target bar is orange first thing in the morning. | The marker moves through the day. If the first picks come in late, the bar is behind until picking catches up. |
| The header says closed, auto refresh paused. | It is outside open hours (a non-working day, or before the working day starts or after it ends). Choose ↻ to load the latest figures. For a screen that should refresh around the clock, add &always=1 to the link (section 2.6). |
| The header says auto refresh paused in Settings. | A manager has turned on Pause auto refresh in Settings > Hours. |
| BC collected is hours old in the morning. | Business Central only collects from 30 minutes before the working day starts, so BC collected shows the last run of the evening until then. The first run collects everything posted overnight; nothing is lost. |
| I cannot save settings. | Display, TV, hours and targets need the Manager role; branding, features and the licence need the Admin role. Ask your administrator. |
Appendix A. Glossary
| Term | Meaning |
|---|---|
| Accuracy % | (Pick lines - stock adjustment lines by the same person) / pick lines x 100. |
| Active hours | The time from a person's first to last pick of a day, at least 15 minutes (0.25 h) per day. |
| Active operator | A person (or login) with at least one pick in the period. |
| Alert | A warning or critical message about work that needs attention (section 8.5). |
| BC collected | When the Business Central collection job last ran. |
| Busy minutes | Time from a person's first to last task of the day, minus idle minutes. |
| Calibration | Setting the task standards from the last 4 weeks of work so that a typical person scores about 100%. |
| Comparison day | The day today is compared with: the previous working day or the same day last week. |
| Courier cut-off | The time orders due today must be shipped by. After it, unshipped orders count as late. |
| Cycle time | From the sales order being created to its last shipment being posted. |
| Daily pick target | The picks the warehouse aims to finish in a working day. |
| Dock-to-stock | From a receipt being posted to it being put away. |
| Earned minutes | The time the work should take under the task standards. |
| Idle minutes | For each gap between two of a person's entries longer than the idle gap: the gap minus the idle gap. |
| KPI limits | The green and amber limits for each KPI, main or per role. |
| Labour cost per picker hour | The cost of one picker for one hour, including wages and on-costs. |
| Late | A due order that is not shipped and has a line due before today, or is past the courier cut-off. |
| Location / Warehouse | A Business Central location. All warehouses adds them together. |
| Open hours | Working days from the working-day start to its end. Outside them auto refresh and TV rotation pause. |
| Open pick lines | Pick lines created in Business Central and not yet registered. |
| Open work snapshot | The count of open pick lines taken once a day at the snapshot time. |
| Operator | The person who did the work, from the scanner-to-person list, or the login if not on it. |
| Operator day | One row per person, warehouse and day with their time, idle time, earned minutes, performance and accuracy. |
| Orders picked | Different source orders with at least one pick line on a day (daily summary, Insights cost per order). |
| Overdue | A purchase order with a line expected before today that is not received. |
| Pace marker | The black mark on the target bar: where picks should be by now. |
| Performance % | Earned minutes / busy minutes x 100. 100% is standard pace. |
| Pick | One registered pick document, whatever the number of lines. |
| Pick line | One line on a pick. |
| Pick rate | Picks per active hour (or the method chosen in Settings). |
| Pick rate target | The pick rate each person aims for, per hour. |
| Picker days | The pickers needed on each day of a week, added up (Planning). |
| Picker hours | The time each picker spent picking: first to last pick per day, at least 0.25 h, added up. |
| Plan | Essentials, Professional or Enterprise: what your licence includes (section 1.5). |
| Put-away | Placing received items in their bins. |
| Role | Viewer, Supervisor, Manager or Admin (what you can change), from your permission set. Operator roles (Picker, Receiver, Put-away, Dispatch) on the scanner list choose the KPI limits. |
| Scanner-to-person list | The list that maps each login to a person and role for a date range. |
| Spare | A login nobody uses in a period; its work shows under the login. |
| Status | On target, Watch or Needs attention: the worst colour of a person's bars. |
| Task standard | Seconds per line plus seconds per document for an activity type. |
| TV link | The app link with tv=1&loc=CODE that opens a warehouse in TV mode. |
| TV mode | The desktop app opened with tv=1: no menu, rotating screens. |
| Working day | The days and hours set as working time, for example Monday to Friday, 6:00 to 16:30. |
Appendix B. Formula reference
Every number in the app, with its exact formula, unit, where it comes from and an example. Source is the Business Central API the app reads (publisher futureLedgerAI, group warehouseOperations, v1.0). The totals APIs add up the Warehouse Activity Entry table, where each entry carries a document count (1 on the first line of each document), an order count (1 on the first line of each order per day), a line count and a quantity. Long periods are summed in Business Central (the period totals APIs).
Common terms: picks = sum of document count of pick entries; lines = sum of line count; units = sum of quantity; orders = sum of order count. Working hours = end hour - start hour in whole hours, from the open from and to times (6:00 to 16:30 counts as 16 - 6 = 10). Times are local to the setup time zone. With warehouse settings on, the chosen warehouse's own hours and targets are used.
B.1 Dashboard
| Number | Formula | Unit | Source | Example |
|---|---|---|---|---|
| Picks | Sum of document count, activity type Pick, chosen date | picks | dailyTotals | 150 |
| Pick lines | Sum of line count, type Pick | lines | dailyTotals | 420 |
| Units picked | Sum of quantity, type Pick | units | dailyTotals | 1,860 |
| Lines per pick | Pick lines / picks (0 when no picks) | lines | dailyTotals | 420 / 150 = 2.8 |
| Pick rate | By the pick rate method (B.3), all operators of the day together | per hour | operatorTotals | 4.7 / hr |
| Active operators | Number of operators with at least one pick on the day | people | operatorTotals | 3 |
| % vs comparison | Round(100 x |day - comparison| / comparison). ▲ and green when day ≥ comparison, ▼ and red when lower. "No comparison" when the comparison value is 0. Comparison day = previous working day, or the same day 7 days earlier | % | as the tile | 120 vs 100 = ▲ 20% vs previous day |
| Target bar | Picks / daily pick target (bar capped at 100%); text shows Round(100 x picks / target) %. Non-working day: no target | % | dailyTotals, setups | 150 / 200 = 75% |
| Pace marker (expected by now) | Daily target x Min(1, elapsed / working hours), elapsed = Min(now in hours, end hour) - start hour, at least 0. Past days: the full target, no marker shown | picks | setups | 11:00, 6-16, target 200: 200 x 5/10 = 100 |
| On pace / behind | Green "on pace" when picks ≥ expected by now, otherwise orange "behind pace, n expected by now" | 92 < 100: behind pace | ||
| Alerts strip | Count of alerts; the message of the most severe (Critical before Warning) | alerts | alerts | 2 alerts |
| Picks by hour | Sum of document count per activity hour, start hour to end hour | picks | hourlyTotals | 9am: 24 |
| Picks by operator | Picks per operator, top 7, most first | picks | operatorTotals | Taylor 2 |
| Activity by type | Sum of line count per activity type for the day | lines | dailyTotals | Put-away 85 |
| Open pick lines now | Sum of lines of open picks, excluding put-aways and place lines | lines | openPicks | 38 |
| Recent warehouse entries | Latest 30 entries of the day by entry number | entries | activityEntries |
B.2 Operator Performance
| Number | Formula | Unit | Source | Example |
|---|---|---|---|---|
| Period | Day = chosen date; This week = Monday to chosen date; This month = 1st to chosen date | |||
| Active time (per operator per day) | Max(15, last pick minute - first pick minute) / 60 on days with picks (pick span) | hours | operatorDayPeriodTotals | 06:58-07:19 = 0.35 h; one pick = 0.25 h |
| Hours active | Sum of active time over operators and days | hours | as above | 0.35 + 0.25 + 0.25 = 0.85 |
| Pick rate (per operator) | Picks (or lines for the lines method) / that operator's hours active | per hour | operatorPeriodTotals | 2 / 0.35 = 5.7 |
| Average pick rate | All picks (or lines) / all hours active (not an average of rates) | per hour | as above | 4 / 0.85 = 4.7 |
| Best pick rate | Highest individual pick rate in the period | per hour | as above | 5.7 (Taylor) |
| Performance tile | 100 x sum of earned minutes / sum of busy minutes, all operators (task standards on); otherwise Lines per pick = pick lines / picks | % | operatorDayPeriodTotals | 32 / 40 = 80% |
| Idle time tile | Sum of idle minutes; % = 100 x idle / sum of span minutes (idle time on); otherwise Hours active | min, % | operatorDayPeriodTotals | 120 min, 6% |
| Rank (#) | 1 + number of operators with more picks (ties share a rank); blank without picks | operatorPeriodTotals | 5, 3, 3, 1 picks: ranks 1, 2, 2, 4 | |
| Pick rate bar | Bar length = rate / Max(1.5 x target, highest rate); marker at the target | per hour | ||
| Rate as % of target | 100 x pick rate / pick rate target; coloured against the Picks vs target limits for the role | % | kpiThresholds | 24 / 30 = 80%: red (amber from 85) |
| Performance bar | Person's earned / busy minutes x 100 on a 0-150% scale, marker at 100%; coloured against Performance limits | % | operatorDayPeriodTotals | |
| Accuracy bar | Person's (pick lines - adjustment lines) / pick lines x 100 on a 90-100% scale; coloured against Pick accuracy limits | % | operatorDayPeriodTotals | 99.5% |
| Idle bar | Person's idle / span minutes x 100 on a 0-60% scale; coloured against Idle limits | % | operatorDayPeriodTotals | 12%: amber |
| Status | Worst level of the four bars: green On target, amber Watch, red Needs attention; – when no bar has a level | one red bar = Needs attention | ||
| Sort Needs attention | Worst level descending, then rate as % of target ascending | |||
| Operator of the period | Operator with the most picks | operatorPeriodTotals | Taylor, 2 picks | |
| Streak | Counting back from the chosen date over the last 28 days, days with picks whose pick rate ≥ target, until the first day below target | days | operatorTotals | 3 days in a row at target |
| By hour (heat map) | Picks per operator per working hour; colour strength = cell / highest cell | picks | operatorHourPeriodTotals |
B.3 Pick rate methods
| Number | Formula | Unit | Source | Example |
|---|---|---|---|---|
| Picks per active hour (default) | Sum of picks / sum of Max(0.25, (last - first pick minute) / 60) over operators and days | per hour | operatorTotals | 4 / 0.85 = 4.7 |
| Picks per hour of the working day | Sum of picks / (number of operators x Max(0.25, working hours so far)); today: hours so far = Min(now, end hour) - start hour; other days: full working hours | per hour | operatorTotals | 150 picks, 3 operators, 5 h: 150 / 15 = 10.0 |
| Pick lines per active hour | Sum of pick lines / the same active hours as the default | per hour | operatorTotals | 12 lines / 0.85 = 14.1 |
B.4 Operator day, standards and calibration
| Number | Formula | Unit | Source | Example |
|---|---|---|---|---|
| Span minutes | Last - first activity minute of the person on the day (all activity types), at least 15 | min | operatorDays | 07:00-15:00 = 480 |
| Gap / idle minutes | For each gap between consecutive entries > Idle gap (default 10): gap - idle gap; summed | min | operatorDays | gaps 4 and 26, idle gap 10: 16 |
| Busy minutes | Span minutes - idle minutes | min | operatorDays | 480 - 16 = 464 |
| Earned minutes | Σ (seconds per line x lines + seconds per document x documents) / 60, using the most specific task standard (warehouse + zone, warehouse, zone, all) | min | operatorDays, taskStandards | 40 x 30 + 12 x 60 = 1,920 s = 32 |
| Performance % | Earned minutes / busy minutes x 100 | % | operatorDays | 32 / 40 = 80% |
| Accuracy % | (Pick lines - adjustment lines) / pick lines x 100; 100 without adjustments; blank without pick lines | % | operatorDays | (400 - 2) / 400 = 99.5% |
| Calibration | Per warehouse, last 4 complete weeks to yesterday: each person's busy minutes shared over their activities by earned minutes; new standard = standard x busy / earned for the activity; only activities with ≥ 10 earned hours; saved as warehouse standards; last 90 days recalculated | factor | setups (calibrate) | busy 360 h / earned 300 h = x 1.2: 30 s → 36 s |
| Rebuild after a change | A changed task standard or a calibration recalculates the last 90 days of statistics in the background, day by day |
B.5 KPI levels and role limits
| Number | Formula | Unit | Source | Example |
|---|---|---|---|---|
| Level (higher is better) | Green if value ≥ Green at; amber if ≥ Amber at; else red | kpiThresholds | Accuracy 99.2, limits 99.5 / 99: amber | |
| Level (lower is better) | Green if value ≤ Green at; amber if ≤ Amber at; else red | kpiThresholds | Idle 8%, limits 10 / 20: green | |
| % of target KPIs | Open pick lines are compared as 100 x open lines / open work target | % | kpiThresholds, setups | 45 / 40 = 112.5%: amber (100 / 125) |
| Role limits | For a person with role R: the row KPI_CODE@R when it exists (each limit falling back to the main row), else the main row KPI_CODE. Role = the role on the person's latest scanner-list line | kpiThresholds, operators | PICKS_VS_TARGET@RECEIVER 60 / 40 | |
| Defaults | Picks vs target 100 / 85; On-time 98 / 95; Late orders 0 / 3 (lower); Open pick lines 100 / 125 % of target (lower); Dock-to-stock 240 / 360 (lower); Pick accuracy 99.5 / 99; Performance 100 / 85; Idle 10 / 20 (lower) | kpiThresholds |
B.6 Trends
| Number | Formula | Unit | Source | Example |
|---|---|---|---|---|
| Per day / per week | 4W and 12W: the measure (picks, lines or units) per day with activity; 6M and 12M: per week (Monday start) | measure | dailyTotals, weeklyTotals | Mon 3 Nov: 180 picks |
| Average (orange line) | Average of the values shown in the chart | measure | as above | (180 + 160 + 200) / 3 = 180 |
| Weekly summary | Picks, lines, units and orders per week, latest 8 weeks | measure | weeklyTotals | |
| Change | Round(100 x (this week's picks - previous week's picks) / previous week's picks), blank when the previous week is 0 | % | weeklyTotals | 900 vs 800 = +13% |
| Open pick lines at snapshot | Sum of open pick lines in the daily snapshot, per day, against the open work target | lines | openWorkSnapshots | 35 vs target 40 |
| Average by weekday | Sum of the measure on that weekday / number of those weekdays with activity | measure | weekdayTotals, dateTotals | Mondays 720 / 4 = 180 |
| On-time % | 100 x outbound flows on time / outbound flows completed. On time = completed date ≤ due date and, when completed on the due date with a cut-off set, time ≤ cut-off | % | flows | 48 / 50 = 96% |
| Cycle hours | Average of (last shipment posted - sales order created) in hours, outbound flows | hours | flows | 08:00 → 11:15 = 3.25 |
| Dock-to-stock min | Average of (last put-away registered - receipt posted) in minutes, inbound flows | min | flows | 09:10 → 11:40 = 150 |
B.7 Dispatch & Inbound
Worked out by Business Central on request (codeunit FLP WO Board Mgt.) from sales and purchase order lines, warehouse shipment lines, warehouse activity lines and posted shipments and receipts.
| Number | Formula | Unit | Source | Example |
|---|---|---|---|---|
| Due today | Sales orders with item lines with outstanding quantity and shipment date ≤ today (one row per order and location), plus orders shipped in full today | orders | dispatchOrders | 24 |
| Waiting | Due order with no pick yet | orders | dispatchOrders | |
| Picking | A pick is open or the order is partly picked | orders | dispatchOrders | |
| Picked, ready | Fully picked, not shipped | orders | dispatchOrders | |
| Shipped today | Shipped in full today (posted shipment dated today) | orders | dispatchOrders | |
| Late | Not shipped, and (earliest open shipment date < today, or the location has a cut-off and the time now > cut-off). Picked but not shipped still counts | orders | dispatchOrders | Due today, 15:20, cut-off 15:00: late |
| % picked | Min(1, quantity picked / quantity) x 100 | % | dispatchOrders | 30 / 40 = 75% |
| Cut-off countdown | Cut-off time - now, as h and min; "passed" after it | time | setups | 1 h 20 min left |
| Inbound: Expected / Partly received / Received | Purchase orders with item lines expected ≤ today: Expected = nothing received; Partly received = some received; Received = received in full today | inboundOrders | ||
| Inbound overdue | Earliest open expected receipt date < today and not received (no cut-off) | inboundOrders | ||
| Put-away lines waiting | Sum of lines of open put-aways | lines | openPicks | 12 |
| Over dock-to-stock target | Receipts awaiting put-away whose receipt was posted more than the dock-to-stock target ago | receipts | flows | 2 |
| Undone today | Sum of lines undone today with Undo Shipment or Undo Receipt | lines | undoneTotals | 3 lines |
| Quantity to replenish | Pick bins with quantity < minimum, or 0 in a fixed bin: maximum - quantity (minimum - quantity without a maximum). Reserve available = the item's quantity in the location's non-pick bins | units | replenishment | min 20, max 100, qty 8: 92 |
B.8 Alerts
| Number | Formula | Unit | Source | Example |
|---|---|---|---|---|
| Pick open too long | Pick or inventory pick with outstanding lines created more than X min ago (X = Alert: pick open; 0 = off). Warning; Critical when ≥ 2 x X | alert | alerts | X 60: open 75 min = warning, 130 min = critical |
| No picks | Working day, within working hours, open pick lines > 0, and minutes since the last pick (or since the working-day start) ≥ Y (Alert: no picks for; 0 = off). Warning | alert | alerts | Last pick 10:05, now 10:30, Y 20: alert |
| Open work high | Open pick lines (excluding place lines) > open work target. Warning | alert | alerts | 52 > 40 |
| Orders late | Count of late, not shipped orders per location > 0. Critical | alert | alerts | 3 orders |
| Purchase orders overdue | Count of overdue, not received purchase orders > 0. Warning | alert | alerts | 2 orders |
| Pick bins to replenish | Count of pick bins to replenish per location > 0 (replenishment on). Warning; Critical when at least one is empty | alert | alerts | 5 bins (1 empty): critical |
| Logins without a name | Logins with activity in the last 7 days and no scanner-list line. Warning | alert | alerts | 2 logins |
B.9 KPI Board
| Number | Formula | Unit | Source | Example |
|---|---|---|---|---|
| Picks vs target | 100 x picks / expected by now (today) or / daily target (past day); blank on a non-working day or without a target | % | dailyTotals, setups | 92 / 100 = 92%: amber |
| On-time shipment | 100 x on-time outbound flows / outbound flows completed on the date | % | flows | 96% |
| Late orders | Late, not shipped orders; today only | orders | dispatchOrders | 2 |
| Open pick lines | Open pick lines now (no put-aways, no place lines); today only | lines | openPicks | 38 |
| Dock-to-stock | Average dock-to-stock minutes of inbound flows completed on the date | min | flows | 150 |
| Pick accuracy | 100 x (Σ pick lines - Σ adjustment lines) / Σ pick lines, all operator days on the date | % | operatorDays | 99.6% |
| Performance | 100 x Σ earned minutes / Σ busy minutes, all operator days on the date | % | operatorDays | 94% |
| Idle time | 100 x Σ idle minutes / Σ span minutes, all operator days on the date | % | operatorDays | 8% |
| Challenge progress | Sum of the measure (picks, lines, units or orders) between the start and end date; team: all operators; individual: the best operator. % = progress / target | % | challenges, operatorDayPeriodTotals | 3,250 / 5,000 = 65% |
| Badges this week | Badges awarded in the 7 days to the chosen date, newest first (up to 8) | badgeAwards |
B.10 Insights
| Number | Formula | Unit | Source | Example |
|---|---|---|---|---|
| Period | Today; This week (from Monday); This month (from the 1st); last 4 weeks (27 days back); last 12 weeks (83 days back); last 6 months; all up to today | |||
| Picker hours | Sum over pickers and days of the pick span: Max(15, last pick minute - first pick minute) / 60 | hours | operatorDayPeriodTotals | 3 pickers x 2 h = 6 |
| Labour cost | Picker hours x labour cost per picker hour ("–" when the rate is 0; "—" for Viewers and Supervisors) | $ | setups | 6 x $35 = $210 |
| Cost per line | Labour cost / pick lines | $ | operatorPeriodTotals | $210 / 420 = $0.50 |
| Cost per pick | Labour cost / picks | $ | operatorPeriodTotals | $210 / 150 = $1.40 |
| Cost per order | Labour cost / orders picked | $ | locationPeriodTotals | $210 / 96 = $2.19 |
| Average picks by hour | Picks in that hour / days with picks in the period; busiest hour in orange | picks | hourPeriodTotals | 9am: 480 / 20 = 24 |
| Accuracy (per operator) | 100 x (pick lines - adjustment lines) / pick lines; green ≥ 99.5, orange ≥ 99, red below | % | operatorPeriodTotals | (150 - 1) / 150 = 99.3%: orange |
| Pick rate colour (accuracy table) | Green ≥ target; orange ≥ 80% of target; red below | setups | Target 30: 25 is orange | |
| Warehouses compared | Per location: picks, lines, orders; picks per day = picks / working days in the period | locationPeriodTotals | 2,400 / 20 = 120 per day |
B.11 Planning
| Number | Formula | Unit | Source | Example |
|---|---|---|---|---|
| Basis | Days from today - 7 x basis weeks up to yesterday (basis 4, 8 or 12; default 8) | dailyTotals, dateTotals | ||
| Expected picks / lines (day) | Sum of the measure on that weekday in the basis / number of those weekdays with picks; "closed" on non-working days | per day | as above | Mondays 168 / 8 = 21 |
| Expected picks / lines (cards) | Sum of the 7 days / number of working days in the week; subtitle "· N a week" = the sum | per day | 105 / 5 = 21 a day · 105 a week | |
| Lines due (day) | Sum of open sales order lines with that shipment date | lines | openOrderLines | 40 |
| Lines already due (card) | Sum over the week | lines | openOrderLines | |
| Lines per pick | Max(1, basis lines / basis picks) | lines | dailyTotals | 2.0 |
| Pickers (day) | RoundUp( Max(expected picks, lines due / lines per pick) / (pick rate target x Max(1, working hours)) ) | pickers | as above, setups | 21 / (4 x 10) = 0.53: 1 |
| Picker days (card) | Sum of pickers over the week; subtitle = highest day | picker days | 1+2+1+1+1 = 6 | |
| Busiest hour | Hour with the highest picks in that hour on that weekday / number of those weekdays | hour | hourPeriodTotals | 9am |
| At peak | RoundUp( average picks in the busiest hour / pick rate target ) | pickers | hourPeriodTotals, setups | 6 / 4 = 1.5: 2 |
| Chart | Blue = expected picks; orange = lines due / lines per pick; label = pickers | picks |
B.12 Items & Bins
| Number | Formula | Unit | Source | Example |
|---|---|---|---|---|
| Period | From the Monday (weeks - 1) weeks before this week to today; weeks 4, 13 or 26 | 13 weeks | ||
| ABC class | Items sorted by pick lines; share of lines before the item < 80%: A; < 95%: B; else C | itemPeriodTotals | top 40 items = 80%: A | |
| Main bin | The from-bin with the most pick lines for the item | itemBinPeriodTotals | A-01-03 | |
| Reslot | A item whose main bin ranking ≤ the ranking that marks the lowest third of the warehouse's pick bins | binUsages | rank 10, cut 20: reslot | |
| Pick lines by zone | Sum of pick lines per zone; % = zone / all zones | lines | zoneHourPeriodTotals | PICK 6,200 = 62% |
| Zone by hour | Pick lines per zone per working hour, 8 busiest zones | lines | zoneHourPeriodTotals | |
| Busiest bins | Top 15 bins by pick lines | lines | binPeriodTotals | |
| Unused pick bins | Pick bins with no pick lines in the period | bins | binUsages | 37 |
B.13 Operator profile
| Number | Formula | Unit | Source | Example |
|---|---|---|---|---|
| Period | Last 12 weeks: today - 83 days to today | operatorDays | ||
| Pick rate | Picks / Σ over days with picks of Max(15, last pick minute - first pick minute) / 60 | per hour | operatorDays | |
| Performance, accuracy, idle | As B.4, summed over the 12 weeks | % | operatorDays | |
| Weekly bar label | Performance % of the week (task standards on) or picks | operatorDays |
B.14 Header and open hours
| Number | Formula | Unit | Source | Example |
|---|---|---|---|---|
| Last refreshed | Time the screen last loaded its figures | time | 10:42:05 | |
| BC collected | Time of the last collection run (latest Last Synced At of all sources) | time | setups | 10:41 |
| Open hours (app) | Not paused, and (&always=1 in the link, or Collect around the clock, or a working day with open from ≤ now ≤ open to); otherwise auto refresh and TV rotation pause | setups | Saturday: closed | |
| Collection window (BC) | Working days, from open from - 30 min to open to + 60 min, unless Collect around the clock is on | 05:30 to 17:30 |