1. Introduction
1.1 What it is
Finance Performance Hub shows how the business is performing, inside Business Central. It has dashboards for finance, receivables and payables, sales, purchasing, cash, GST, commitments and dimensions, with forecasts, alerts, a monthly PDF pack and Excel reports.
It is a Business Central extension. There is no Power BI workspace, dataset or separate sign-in. The figures are built from your own ledger and stay in your Business Central database.
The hub is read-only on your business data: it never posts and never creates or changes documents, journals, ledger entries, budgets or master data. It writes only its own tables and schedules its own job queue entries.
1.2 Who it is for
- Financial controllers, CFOs and accountants who report on results each month.
- Business owners and managers who want the headline figures and what needs attention.
- Sales and purchasing managers who want their own area's figures.
- An administrator, who sets the hub up and looks after the mapping, budget and alerts.
1.3 How it works
The hub does not read the ledger each time a page opens. A job queue entry reads new ledger entries every hour and adds them to monthly summary tables. The dashboards read those summaries, so pages open quickly whatever the size of the ledger.
- New G/L, customer, vendor, value and GST entries are read since the last run. Open receivables, payables and order lines are taken as a fresh snapshot each run.
- Each night at 2:00 AM the hub recalculates forecasts, runs the alert rules and, if set up, sends alert notices and the monthly pack.
- When you open a page, the hub builds it from the summaries. When you click a figure, it opens the Business Central entries behind it.
1.4 What is not in version 1
Inventory and Projects dashboards, reporting across several companies, bank covenants, and taking actions from the dashboard (for example sending a reminder) are not part of this version.
Version 1 has no AI features and sends no data to any AI service.
2. Install and first-time setup
Allow about 30 minutes. You need the FLP FP ADMIN permission set.
2.1 Install and assign access
- Install Finance Performance Hub from its Microsoft AppSource listing, or ask your Business Central partner to install it. For a demo first, contact us.
- Assign a Finance Performance Hub licence to each user in the Microsoft 365 admin center.
- In Business Central, assign FLP FP ADMIN to the person who sets the hub up, and FLP FP VIEW to everyone else (chapter 11).
On install, the hub suggests an account mapping, picks up your budget and dimensions where it can, and creates the hourly job queue entry in each company that has a chart of accounts.
2.2 The setup wizard
Search for Set up Finance Performance Hub, or open Assisted Setup. The wizard has seven steps.
| Step | What you do |
|---|---|
| 1. Welcome | Check the company name. |
| 2. Financial year and cash | Set the month your financial year starts (7 is July). This setting belongs to the hub; your accounting periods are not changed. Enter a minimum cash balance for the cash forecast. Choose how much monthly detail to build: all history, this year and the two years before (recommended), this year and the four years before, or from a date. Choose whether to keep everything or a rolling 3, 5 or 7 years. |
| 3. Account mapping | Each posting G/L account gets a class, such as Revenue, Cost of Sales, Operating Expense, Cash or Receivables. The hub suggests one. Choose Review account mapping, correct anything wrong, then tick I have reviewed the mapping. |
| 4. Budget | Pick an existing G/L budget to compare with, or leave it blank to compare with last year. No budget yet? Choose Open G/L Budgets to create or import one in Business Central, then pick it here. The hub only reads budgets. |
| 5. Dimensions | See which dimensions the Dimensions area will offer (the global and shortcut dimensions in General Ledger Setup). Optionally pick a State dimension and a sales channel dimension, and enter salesperson targets. |
| 6. Alerts and the monthly pack | Optional. Enter who receives alert emails, a Teams webhook, the lowest severity to send, who receives the monthly pack and on which day. Open the Obligations list to add payroll, rent, loans and tax. |
| 7. Build the dashboards | Leave Refresh every hour with the job queue ticked and choose Finish. |
Finish saves the setup, builds the summaries from your ledger, calculates forecasts and alerts, schedules the job queue and opens the Data Readiness page. The first build reads the ledger once. Later refreshes read only new entries.
Periods before the start you chose are kept as one brought-forward balance per account, so cash, balances and ratios stay correct. Your ledger entries are never changed or deleted.
2.3 Account mapping
The mapping is what makes every formula mean the same thing in every company. Business Central account categories differ from one chart of accounts to the next, so the hub uses its own classes:
- Income statement: Revenue, Cost of Sales, Operating Expense, Other Income, Other Expense, Depreciation & Amortisation, Interest, Income Tax.
- Balance sheet: Cash, Receivables, Inventory, Other Current Asset, Non-current Asset, Payables, Other Current Liability, Non-current Liability, Equity.
Open Account Mapping to review it at any time. Show unmapped lists accounts with no class. Suggest again re-runs the suggestion. Confirm all marks the mapping as reviewed. A change to an account's class updates the dashboards straight away.
Things worth checking on your own chart:
- A cost account filed under an income category should be Cost of Sales, or it reduces revenue.
- Payroll tax and fringe benefits tax are running costs: Operating Expense, not Income Tax.
- Grants are Other Income, not Revenue.
- An overdraft you operate from day to day belongs in Cash. Cash will then show as negative, and total assets and total liabilities will each be lower than on the chart of accounts by the overdraft. Net assets do not change.
- Decide which loans are long term. Non-current Liability keeps them out of working capital and the current ratio.
Until the mapping is confirmed, ratios and EBITDA are labelled provisional.
2.4 The Data Readiness page
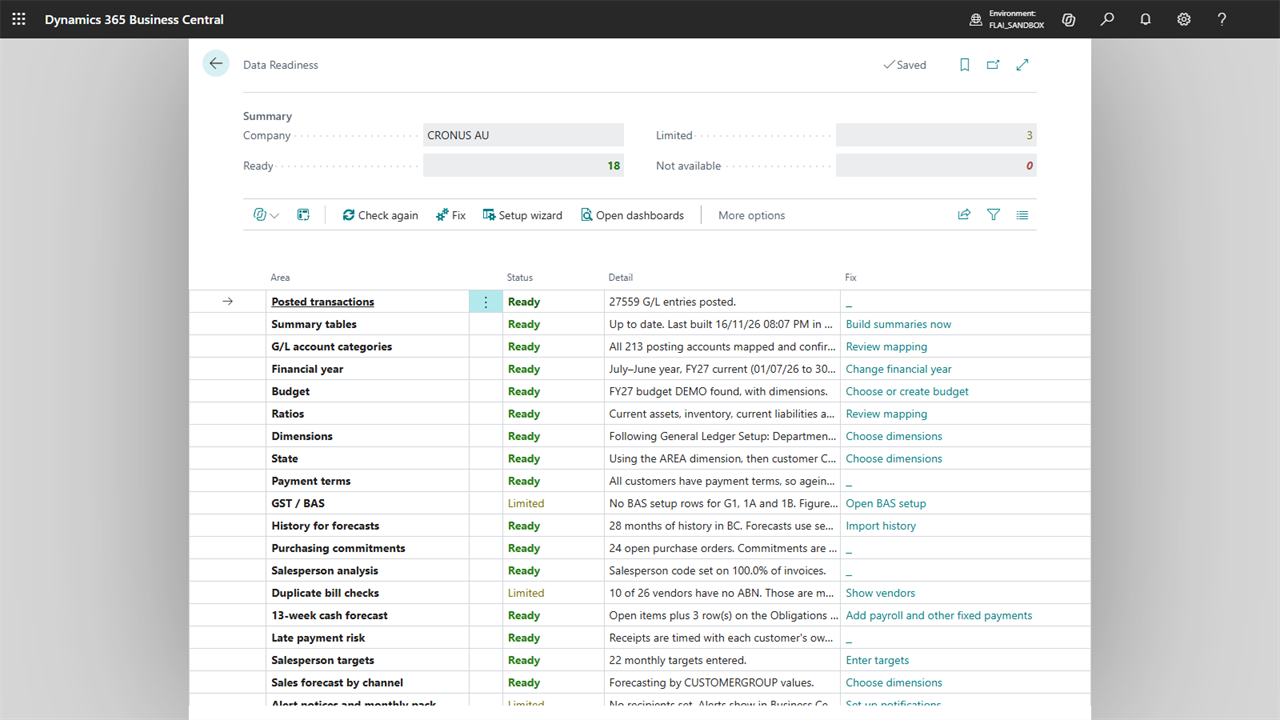
Data Readiness lists each part of the hub as Ready, Limited or Not available, with the reason. Select a line and choose Fix to go to the place that fixes it. Choose Check again after a change.
It checks, among other things: posted transactions, the summary tables, account mapping, the financial year, the budget, ratios, dimensions, state, customer payment terms, GST and BAS setup, history for forecasts, purchase commitments, salesperson codes, vendor ABNs for the duplicate bill check, the cash forecast, the scheduled refresh, salesperson targets, the sales forecast by channel, and alert notices.
"Limited" does not mean broken. It tells you what the hub is doing instead. For example, with no BAS setup rows the GST figures are estimated from GST entries and labelled as estimates.
2.5 Keeping the figures current
- The job queue runs two entries for codeunit FLP FP Summary Builder:
SUMMARYevery 60 minutes andNIGHTLYdaily at 2:00 AM. - Refresh data on the hub, or Refresh now on the Setup page, reads new entries immediately. This needs FLP FP ADMIN.
- Rebuild from scratch on the Setup page recreates every summary from the ledger. Use it after something unusual, such as date compression.
- Schedule hourly refresh on the Setup page recreates the job queue entries if they are missing.
3. Finding your way around
Search for Finance Performance Hub. To make it your home page, choose Settings > My Settings > Role > Finance Performance. A Finance Performance tile group is also added to the Business Manager and Accountant role centres.
The hub is one page.
- Areas run across the top: Executive, My view, Finance, Receivables & Payables, Sales, Purchasing, Cash, GST, Commitments and Dimensions.
- Pages for the open area run down the left.
- Period (top right): year to date, month, quarter or rolling 12 months.
- Compare with: budget or last year.
- Month: the report month. It starts on the current month, with data to today. Pick an earlier month to report to that month end. Your choice is kept for every area for the rest of your session.
Every page opens with its headline tiles. Each tile and chart has an i icon: hover or tap it to see how the figure is calculated.
Open a tile to see more:
- the chart or the table behind it
- Why did this change?
- how it is calculated
- a note for the month, shared with everyone who uses the hub
- Break down by on revenue and spend tiles
- Pin to My view, Send to Excel (a CSV file) and Print
Click a bar, point or figure to open the Business Central entries behind it. Profit figures open G/L entries for the period. Balance figures open the chart of accounts for the mapped accounts. Others open open items, ledger entries, orders, GST entries or the Obligations list. A figure with no single list behind it, such as a forecast, shows how it is calculated instead.
3.1 Unfinished months
When the report month is not finished, last year is read to the same day, and the month's budget is cut to the days passed. A chip at the top right of the page says so. Days to collect, inventory days and days to pay use the days passed, not a full quarter.
4. The areas
4.1 Executive
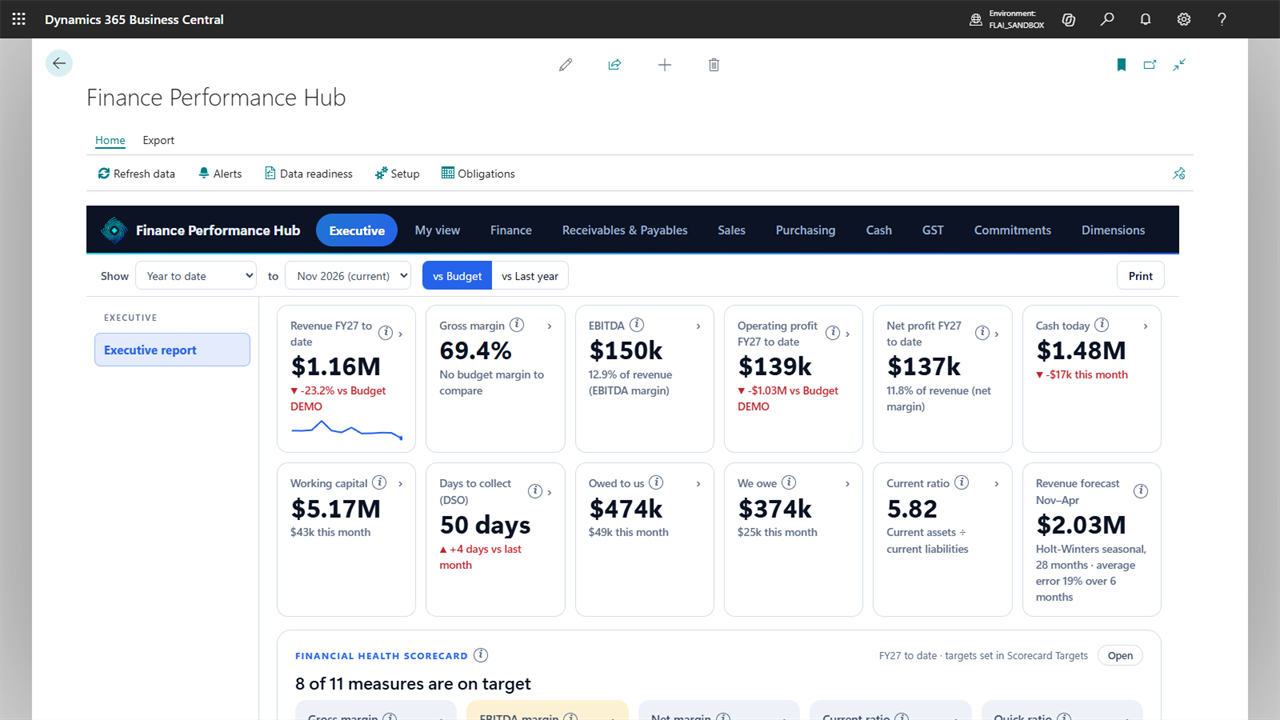
One page for the board. Twelve headline tiles: revenue, gross margin, EBITDA, operating profit, net profit, cash, working capital, days to collect, owed to us, we owe, current ratio and the revenue forecast. Under them: the financial health scorecard, commentary, revenue against budget or last year with the forecast range, open alerts, the operating profit bridge, the year-end outlook and what-if sliders.
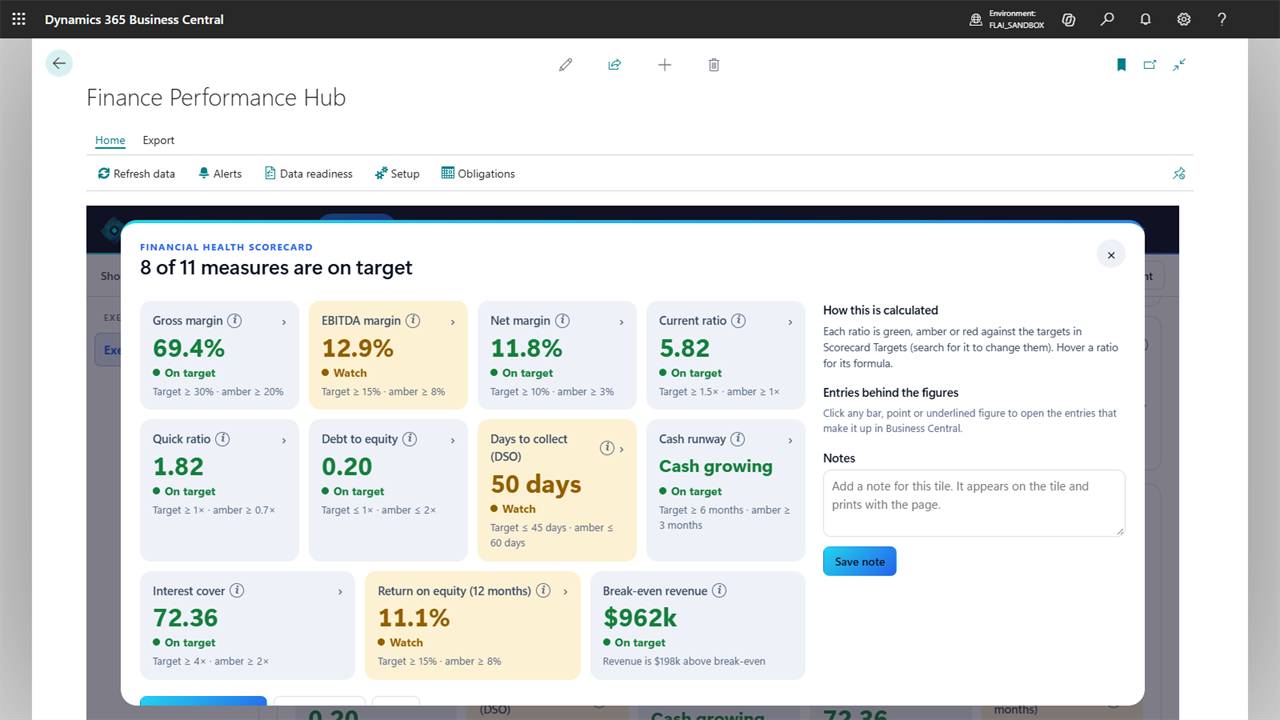
The scorecard rates each measure green, amber or red against targets you set in Scorecard Targets: margins, current and quick ratio, debt to equity, days to collect, cash runway, interest cover and return on equity, plus break-even revenue. You can change a threshold or hide a measure. With negative equity, debt to equity reads "Negative equity".
The commentary is written from templates using the calculated figures. No AI is used.
4.2 My view
Your own page. It starts with the executive tiles and a standard set of charts. Open any tile anywhere in the hub and choose Pin to My view to add it, or Unpin to remove it. Pins are per user.
4.3 Finance
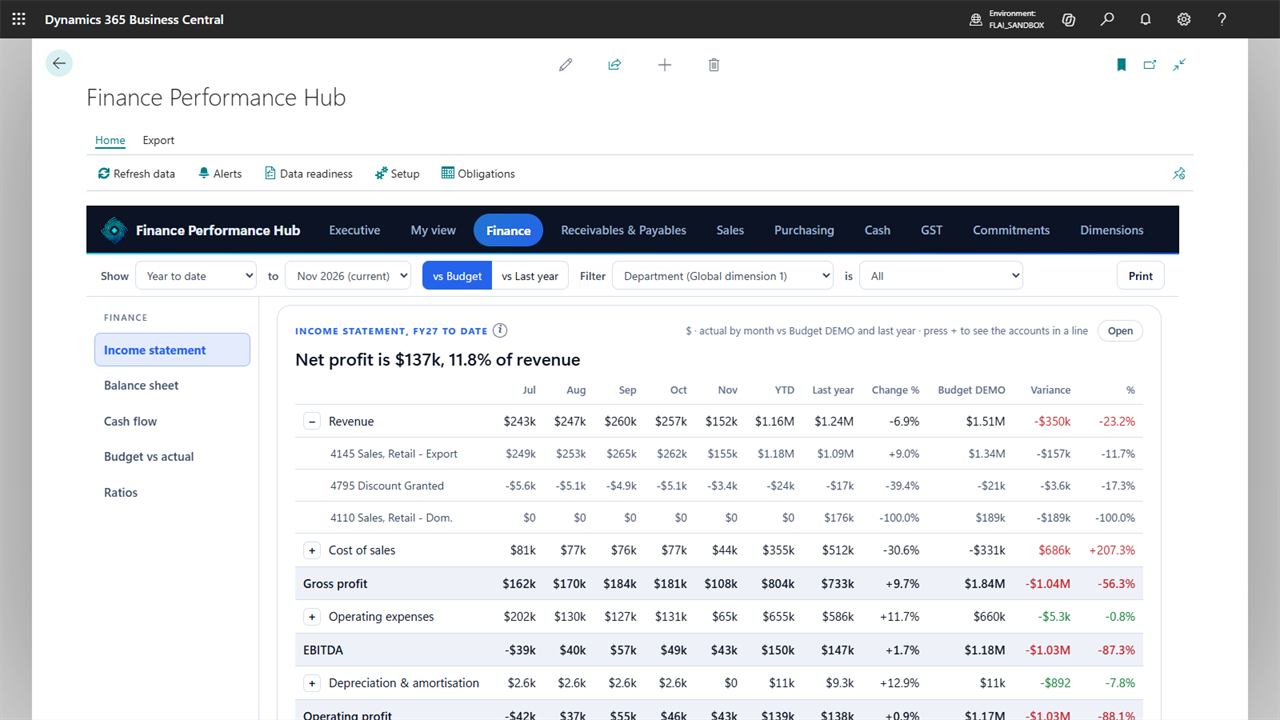
| Page | What it shows |
|---|---|
| Income statement | Revenue to net profit by month. Lines expand to G/L accounts, with last year and the change. Also the profit trend, EBITDA by month and a rolling 12-month P&L. |
| Balance sheet | Assets, liabilities and equity at the month end, expanding to accounts, and working capital. |
| Cash flow | A cash bridge and an indirect cash flow statement. |
| Budget vs actual | The profit bridge, the biggest differences by account, where the money goes and spending patterns. |
| Ratios | The scorecard, profitability ratios and working capital days. |
How it ties to Business Central. Revenue is the total of the accounts mapped to Revenue. Compare it with the Chart of Accounts using the same date filter. Always set the date filter: without one, Business Central adds entries outside the period. Equity is everything not mapped to an asset or liability class, so the balance sheet always balances.
A dimension filter on the Finance area narrows every figure to one dimension value. A budget entered without that dimension compares as zero while the filter is on.
4.4 Receivables & Payables
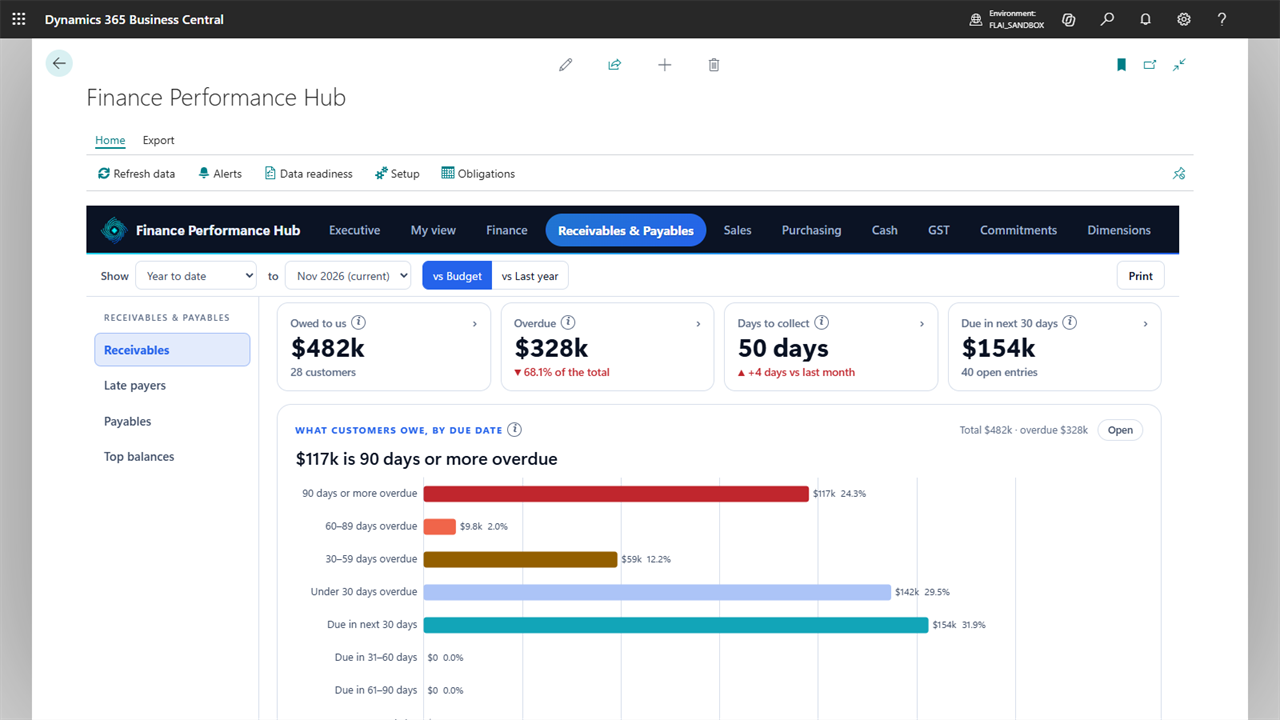
| Page | What it shows |
|---|---|
| Receivables | What customers owe, how overdue it is and what falls due next. |
| Late payers | Who pays late, by how much and how often. |
| Payables | What you owe, how overdue it is and what falls due next. |
| Top balances | The largest balances by customer and vendor, with risk scores. |
Ageing follows Business Central's Aged Accounts Receivable and Aged Accounts Payable reports run by due date with a 30-day period: not due, under 30 days, 30 to 59, 60 to 89, and 90 days or more overdue. An invoice due on the report date already counts as overdue, as it does in those reports.
These pages are always as at today, because Business Central keeps open entries only as they are now. If you pick an earlier month, a note on the page says so. Customer names are the current names on the customer cards.
4.5 Sales
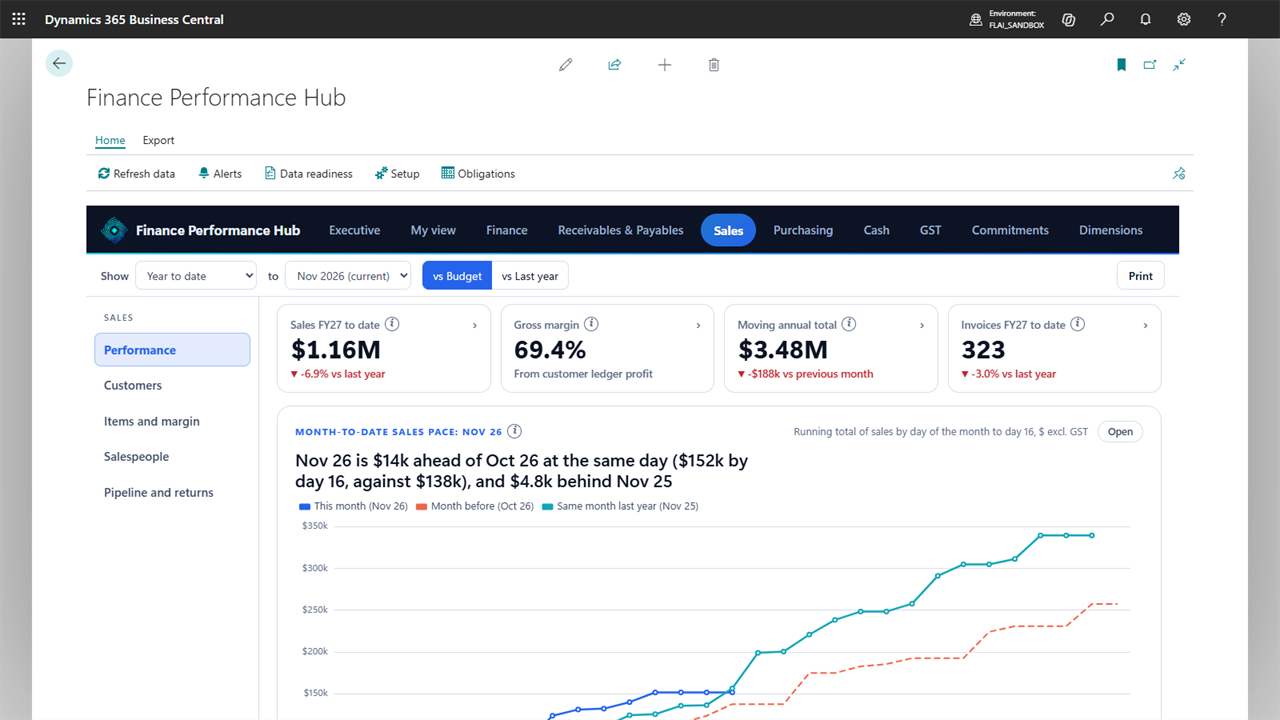
Pages: Performance, Customers, Items and margin, Salespeople, Pipeline and returns. They cover this year against last year, month-to-date pace, sales by weekday, average invoice value, top customers with margin, customer concentration, new, returning and lost customers, sales by state, items and margin, price, volume and mix, salespeople against target, open orders and quotes, and returns.
Sales here is customer ledger sales. Gross margin appears in two places on purpose. On Finance it comes from the ledger and includes journals and stock adjustments. On Sales it is invoice profit from the customer ledger. The two can differ.
Open quotes show the total and how much of it is over 90 days old. Open order and pipeline tiles show orders as they stand today, whatever month is picked. The Salespeople page needs salesperson codes on invoices. Salesperson targets are the hub's own list. Target Uplift % (last year + X%) on the Setup page is the percentage added to last year's sales when you create targets from last year.
4.6 Purchasing
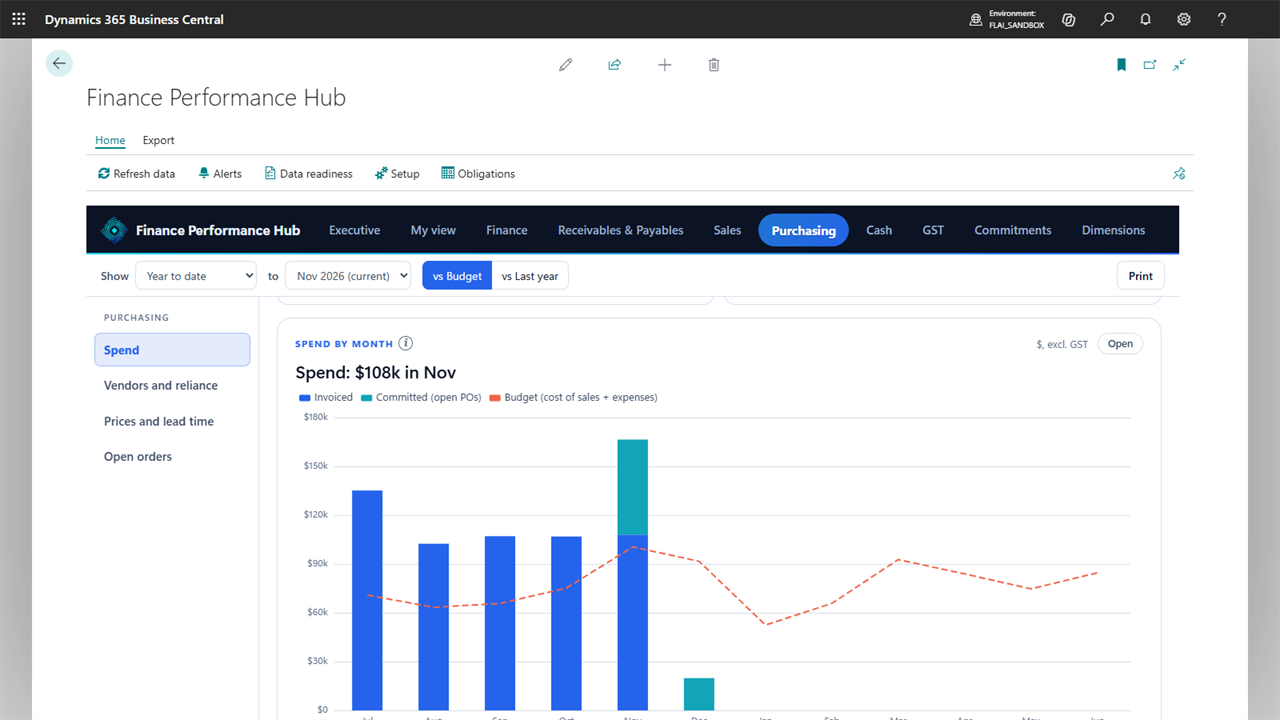
Pages: Spend, Vendors and reliance, Prices and lead time, Open orders. They cover spend by month, costs by category and by department, top vendors, vendor concentration, single-supplier items, a price index by item, lead time, and open purchase orders.
Spend is purchase invoices excluding GST. Costs by category is the ledger's cost of sales and expenses, wages included, so the two are different totals. The price index sets each item against its own first price in the last 12 months, weighted by spend.
4.7 Cash
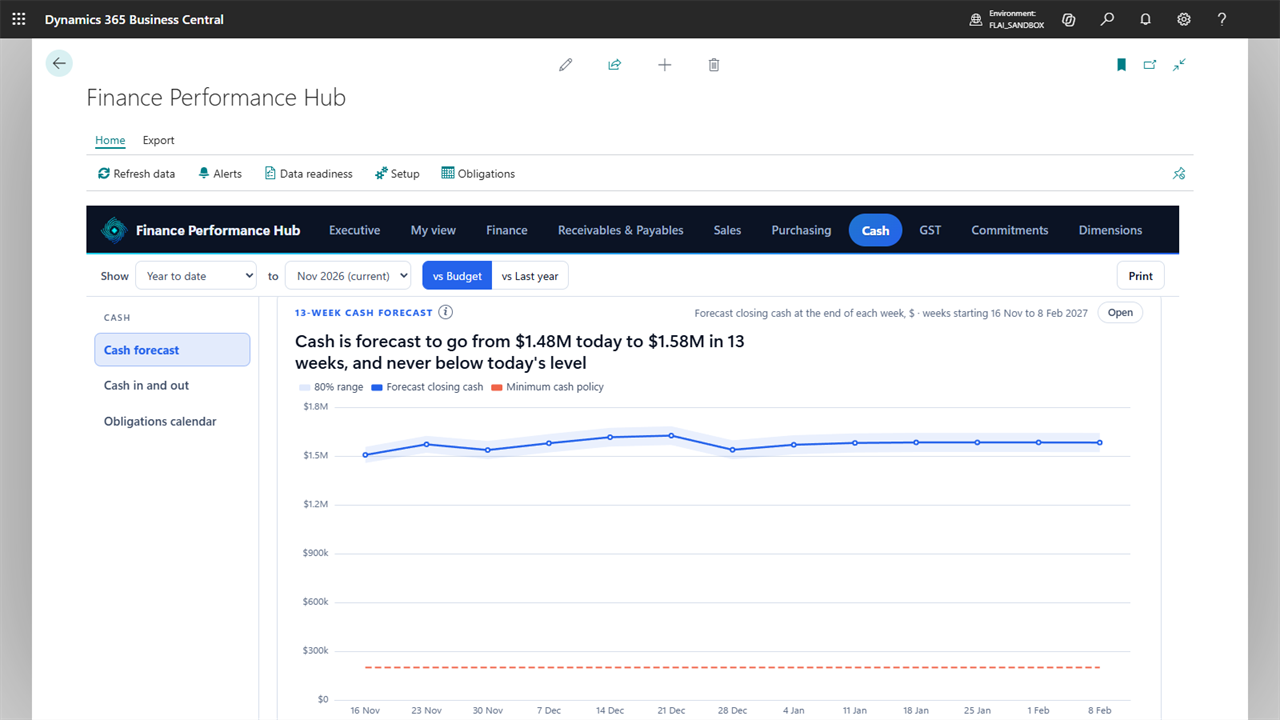
| Page | What it shows |
|---|---|
| Cash forecast | 13 weeks ahead, with a range and your minimum cash line. |
| Cash in and out | Cash received, cash paid and the net movement, with a cash bridge. |
| Obligations calendar | Tax, super, payroll and other fixed payments on their due dates. |
Chapter 6 explains the forecast and the Obligations list. Cash in and out counts only bank accounts that post to a Cash-class G/L account, so a loan or card set up as a bank account is left out. Cash received and cash paid are gross figures; the rows under them are net of refunds.
4.8 GST
Pages: BAS, and GST by month. Chapter 7.
4.9 Commitments
Pages: Overview, By department, By account, Committed orders. The idea is: budget, less what is spent, less what is already on order, leaves what is free to spend.
- Budget: the G/L budget for cost accounts for the financial year.
- Spent: posted cost on those accounts to the report date.
- Committed orders: ordered but not yet invoiced on released purchase orders, excluding GST.
- Awaiting approval: the same on orders that are open or pending approval.
- Remaining: budget less the three above.
This area needs a budget for cost accounts. If that budget is zero or negative, the page can read "over budget"; treat it as no budget.
4.10 Dimensions
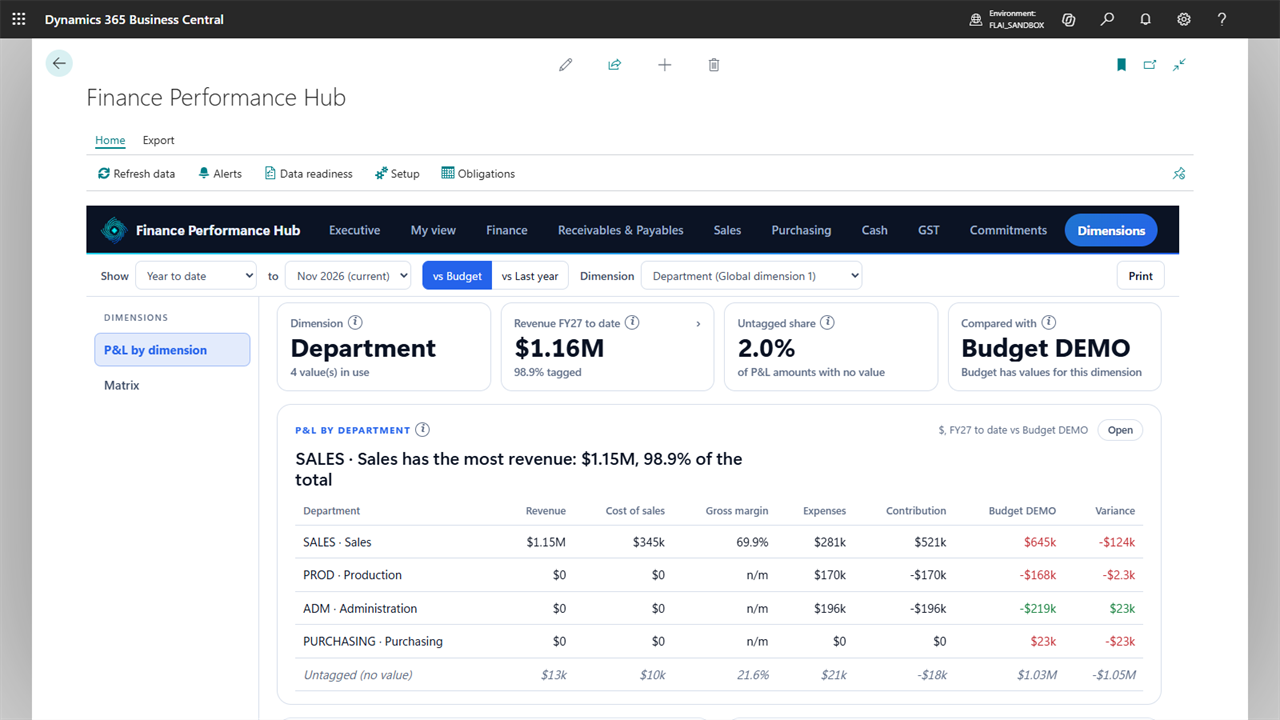
Chapter 8.
5. Alerts
The alert rules run each night. Open Finance Alerts from the hub.
| Rule | What it looks for |
|---|---|
| Possible duplicate bill | Same vendor or ABN, same amount, dates close together, similar invoice numbers. |
| Unusual amount | An account's month far from its 12-month average. |
| Sustained cost increase | A cost account above its 12-month average three months running. |
| Weekend or overnight posting | Journals posted on a weekend or outside business hours. |
| Days to pay jump | A customer paying much later than before. |
| Missing dimension | P&L amounts with no value for the main dimension. |
Each alert has a severity: Review, High or Critical. Thresholds are on the Setup page under Alert rules. Dismiss an alert once you have reviewed it; Show dismissed too brings them back into view. Dismissing and Run rules now need FLP FP ADMIN.
An alert is a prompt to look, not a finding. A possible duplicate may be two real bills.
New alerts can be emailed each night or posted to a Teams channel. Email uses a Business Central email account: assign the scenario "Finance Performance alerts and monthly pack" in Email Scenario Setup. For Teams, paste an incoming webhook or Workflows URL in Setup and allow HttpClient requests for the extension in Extension Management.
6. Obligations and the cash forecast
The 13-week cash forecast adds up:
- open receivables, each at its due date plus that customer's own average days late
- open payables at their due dates
- unpaid rows on the Obligations list, in the week they fall due (overdue ones in week 1)
- the quarterly BAS payment: the amount on a BAS row in the Obligations list, or an estimate from posted GST when that row is left at zero
Open invoices and bills are not enough for a full forecast. Payroll, super, rent, loan repayments and tax are usually not in Business Central as open bills. Put them on the Obligations list.
Each row has a type (BAS, PAYG withholding, Superannuation, Payroll tax, Payroll, Loan repayment, Insurance, Rent, Other), a description, a due date, an amount, a recurrence (once, weekly, fortnightly, monthly, quarterly, half-yearly, annually) and an optional end date. Tick Money In for money received on a fixed date. Mark as Paid ticks a one-off payment, or moves a repeating one to its next date.
Suggest Obligations proposes rows from recurring general journals, recurring purchase lines, tax and super balances, and the last three full months of the ledger. You review them on a separate page and add the ones you want. Nothing is added until you choose it, and the amounts are estimates to correct. Suggest BAS dates adds the next four quarterly due dates with the amount left at zero.
The forecast is an estimate. It does not know about sales not yet invoiced or bills not yet received.
7. GST and BAS
The BAS page shows G1 (total sales), 1A (GST on sales) and 1B (GST on purchases) for the quarter to date and the last four quarters. GST by month shows net GST by month and by posting group.
If your BAS setup has GST entry totalling rows for G1, 1A and 1B, the hub uses them. If not, it estimates the figures from GST entries by type and labels them as estimates. To check a quarter, open GST Entries in analysis mode, filter the posting dates, and sum Base and Amount by Type.
Quarterly due dates follow the ATO: 28 October, 28 February, 28 April and 28 July.
The page is a management view. It does not prepare or lodge a BAS. BAS and the ATO dates are Australian; the GST by month page reads GST entries in any company.
8. Dimensions
The P&L by dimension page shows revenue, costs and contribution for each value of a dimension, with an "Untagged" row for amounts with no value, contribution against budget or last year, a monthly heat map and the revenue trend by value. The Matrix page shows contribution for every pair of values of two dimensions.
Pick the dimension at the top of the page. The list follows the global and shortcut dimensions in General Ledger Setup. If the budget has no values for the chosen dimension, the page compares with last year and says so.
9. Budgets and forecasts
Comparisons. Every page compares with the selected G/L budget or with the same months last year. Switch at the top of the hub. With no budget selected, the hub uses last year and says so. The hub only reads G/L budgets: create, import and change them on the G/L Budgets page in Business Central.
Forecasts. Revenue forecasts use a standard seasonal method (Holt-Winters) when there are 24 months of history, and trend only with 12 to 23 months. Under 12 months they are hidden. Ranges are 80% ranges. If you moved to Business Central with opening balances only, import earlier monthly P&L history from Excel on the Imported Monthly History page.
Forecast Accuracy shows how close past one-month-ahead forecasts were to actuals. The year-end outlook on the Executive page adds the forecast for the rest of the year to the actuals so far.
A forecast is a projection of past patterns. It does not know about a new contract or a lost customer.
10. The monthly pack and Excel reports
The Export group on the hub has:
- Monthly pack (PDF): key figures, the income statement, ageing and alerts to review for the report month.
- P&L to Excel: the monthly income statement by account for this and last financial year.
- Sales to Excel: sales by customer, state, salesperson and month.
- Aged balances to Excel: open receivables and payables by ageing bucket.
The pack can be emailed each month. Enter the recipients and the day of the month in Setup. Email monthly pack now sends it immediately.
For your own pivots, the role centre's Analysis lists open the monthly G/L, sales, purchase, GST and item summaries, open items and forecasts as lists that support Business Central's data analysis mode. The same summaries are available as read-only API pages under api/futureLedgerAI/financePerformance/v1.0.
11. Permissions
| Permission set | For | Allows |
|---|---|---|
| FLP FP VIEW | Everyone who uses the hub | Open every area, pin tiles, add notes, run the pack and Excel reports, view alerts, obligations and readiness. |
| FLP FP ADMIN | The person who looks after the hub | Everything in VIEW, plus the setup wizard, Setup, account mapping, refresh and rebuild, obligations, targets, imported history and dismissing alerts. |
These sets cover the hub's own objects. Users also need their usual Business Central permissions to open the standard pages a drill-down leads to. SUPER is not needed.
12. Data and privacy
- All hub data is in the hub's own tables in your Business Central database, per company. Nothing is stored outside Business Central.
- The charts are drawn by a component shipped inside the extension. It loads nothing from the internet.
- Data leaves Business Central only if you turn on one of two things: alert and pack emails, or Teams notices.
- Version 1 has no AI features. Nothing is sent to any AI service.
- The hub records who last changed a tile note, and each user's pinned tiles.
- You choose how much monthly detail is kept (chapter 2). Uninstalling the extension with Delete data removes the hub's tables. Your ledger is untouched.
- Privacy policy: https://www.futureledgerai.com/privacy.html
13. Troubleshooting
| What you see | What to do |
|---|---|
| The hub asks to build the summaries | Choose Yes. It reads the ledger once. |
| A page is empty or a figure is missing | Open Data Readiness and use Fix on the line that is Limited or Not available. |
| Figures look out of date | Choose Refresh data. Check the job queue entries exist (Readiness line "Scheduled refresh"). |
| Revenue or margin looks wrong | Check Account Mapping. One account in the wrong class is the usual cause. |
| The hub differs from the Chart of Accounts | Set the same date filter on the Chart of Accounts. Check for an overdraft mapped to Cash. |
| Ratios or EBITDA say provisional | Confirm the account mapping. |
| No forecast | Fewer than 12 months of history. Import earlier history or wait. |
| GST figures say estimate | There are no BAS setup rows for G1, 1A and 1B. |
| The cash forecast looks too good | Add payroll, super, rent, loans and tax to the Obligations list. |
| Receivables do not match an earlier month end | Receivables and payables are always as at today. |
| Commitments reads over budget with no real overspend | The cost budget is zero or negative. |
| Alert emails do not arrive | Check recipients in Setup and the email account assigned to the hub's scenario. |
| Teams notices do not arrive | Allow HttpClient requests for the extension in Extension Management. |
| Print does nothing | Use Monthly pack (PDF) or Send to Excel instead. |
| Refresh data gives a permission error | Refreshing needs FLP FP ADMIN. |
14. Support
- Guide: https://www.futureledgerai.com/finance-performance-hub-guide.html
- FAQ: https://www.futureledgerai.com/finance-performance-hub-faq.html
- Email: info@futureledgerai.com
- Licence terms: https://www.futureledgerai.com/finance-performance-hub-eula.html
When you write to us, tell us the Business Central version, the hub version from Extension Management, the area and page, and the report month. Do not send customer data by email.